For a full tutorial on how to make this project/all the code, visit the repository here. This article is mainly about the design/implementation process.
Lately I’ve been flying 3D printed rockets. They haven’t been very serious, and the results have been interesting. They’re often filled with popcorn, painted, and running on cheap Estes motors. It’s been really fun, but I want something a little more robust when it comes to estimating how high they went. Counting and doing some math is fun and all, but it comes with errors and doesn’t include data points by the hundred milliseconds. I think you see where this is going.
Below are some of my 3D printed rocket endeavors:


Some(like the upper left hand corner) turned into deadly projectiles upon falling back to Earth, some splattered popcorn all over my local launch ground, Rocket Field.
Long story short, I’ve been slacking on some microcontroller projects, and am in great need of something to do since my internship for the summer has ended. Cue inspiration from a jar of peanut butter and 30 seconds in photoshop, and you get Project Skippy:
I had 3 main goals: tell how high my rocket goes, see how much strain its under, and get some cute graphs out of the whole ordeal.
The first thing I had to do was figure out what I was going to use for the brains. An Arduino Uno was too big, a Raspberry Pi Zero too cumbersome to power. . . and then after scouring the Adafruit website, I found the perfect thing:

the adalogger 32u4
Isn’t it beautiful? At least I think it is. It’s a super cute ATmega32u4 that happens to have a ton of really cool built-in features. The ones that I cared about mostly were that it runs on 3.3V logic which is perfect for the sensors I wanted to use, has a built-in micro SD card interface, and has a connector for a 3.7V Lithium polymer battery that engages automatically when you disconnect the micro USB power supply. In a word, it was perfect.
Now that I had the brains of my flight computer, I needed the rest of the central nervous system. I’m not too familiar with sensors so I kind of just went with what looked good on Adafruit. I settled on the following 2 sensors:

Adafruit MPL115A2 Barometric Pressure/Temperature Sensor

Adafruit LIS3DH Triple Axis Accelerometer
The last big component I relied on was a 3.7V 500mAh lithium polymer battery to power the whole set up.
When all of these components arrived in the mail, I was initially very naive. Don’t get me wrong, I’m still very naive, but I kind of had the impression I could just get these things and hook them all together, write a little code, and they would magically work. Then I started learning about how these sensors actually work.
My barometric pressure and temperature sensor is restricted to only using I2C - a common serial protocol that uses 2 wires, in this case, the SDA and SCL pins. My accelerometer however can communicated using either I2C or SPI protocols, with SPI being the faster option. In the future I’ll probably investigate the advantages surrounding SPI more, but for now I decided to stick with I2C.
Then another interesting roadblock came my way: the Adalogger has a single set of I2C pins. Having just read a Wikipedia article about I2C, I had no idea if multiple sensors could be hooked up to a single I2C set of pins. A quick trip down a YouTube rabbit hole told me that to havie multiple sensors on a single I2C set of pins, I would require either a complex set up with multiple mosfets or some complex multiplexing. So I ignored that and went about singular tests. These are all documented on the project’s page, but I’ll talk about them a little. They were all sanity tests just to make sure every individual component worked on its own. They are as follows:
adalogger-blink-test.ino
adalogger-sd-card-test.ino
altimeter-test.ino
accelerometer-test.ino
The first was a sanity check to make sure I could even upload a proper sketch to the board. It just makes the onboard LED blink, and assures you that all is well. The second was a check to make sure I could interface with the micro SD card. This required some rudimentary file IO, and it just writes some fun random lines to a text file it creates. Since everything seemed fine with what the board was responsible for, I moved on to testing the sensors. First up was the altimeter, or the MPL115A2. I hooked it up to the I2C pins on the Adalogger(pins 2 and 3), and ran my program, which continually prints its readings for pressure, altitude, and temperature. Already I noticed these values would have to be scaled; for example altitude was relative to sea level. Due to this, I started a list of values that would have to be scaled during data logging. For example, all altitude measurements would have to have a base measurement taken at start-up subtracted from it so I could get the true altitude of my rockets. Finally, I tested the accelerometer, or the LIS3DH, connecting it to the I2C pins as I did with the altimeter. This test was similar to the one prior, and just printed out the X, Y, and Z components of the acceleration out to the serial monitor at regular intervals. This sensor was fancier in comparison to the altimeter and had options for setting things like a range and a data rate. For right now I went with the standard defaults, as I need to do more research into what the optimal settings would be for a model rocket flight computer.
At this point, I was pretty happy. All the tests went along without a hitch, and now I just needed to figure out the whole ‘can a single I2C bus handle multiple sensors’ ordeal. Thankfully, this problem was pretty much solved for me.
Like I mentioned, I came across a lot of scary and complex sounding YouTube videos that made it seem like having multiple sensors on a single I2C bus would be harder than trying to escape a riptide on a foggy day. Then, in reading through the documentation for the LIS3DH, I found exactly what I needed, in the form of a comment:

Click for Original Code
It’s a wonderful thing when things work out this perfectly. It seems as though the Adafruit libraries for these sensors do all the grunt work for me. If my altimeter happens to be at address 0x18, I can simply initialize my accelerometer to begin using address 0x19 instead of 0x18. Neat.
So, now I had my fix: I could just wire it all up and let the libraries do the work. This prompted my next test, combined-alt-accel-test.ino, which was basically a combination of the two isolated sensor tests, except now they were both connected at the same time. It went swimmingly, so I drew up some schematics with some extra features, like a logging status LED and a slide switch for the power supply, and came up with the following:


Now for the code. Initially I wanted to get fancy with it, but decided against it, and settled on an automatic flow. When switched on, the program starts. If all sensors and files can be correctly initialized and opened, it logs data for 10 minutes, taking readings at every 100 milliseconds, and then shuts off. Not too elegant, but it gets the job done. However, in testing this version, I found I would get crazy readings from the altimeter after a couple iterations: the altitude at 500 milliseconds from start might be something like 25,000 meters. This is once again where my lack of knowledge kicks in and I had what I’ll call a learning moment. Thankfully, I have a lot of friends who already knew about this.
When reading data from a sensor with a microcontroller, it’s bound to be noisy. Hence, most every project that uses sensors employs a data filter to lessen the effects of this noise. In addition to this, I forgot to think like a scientist. What does the scientific method dictate you do? Get your results repeatedly, and compare them. At the beginning I was only reading these sensors once, and tossing them into a CSV file. I didn’t care to check if they followed a general trend, or if their measurements made sense in the context of their use(like when I got an average reading of 600 pascals during one test - I definitely wasn’t testing on Mars!). To mitigate this, I went for another quick and dirty fix, which was to read the values twice, and then log them. Throughout my tests this now gave me reasonable data that matched local weather reports and made sense. Instead of noting a rise in altitude of 25,000 meters when I walked upstairs, it now registered something like 4 meters. Perfect.
Now for the data parsing. You’ll notice in the paragraph above I mentioned CSV file. Originally it was a .txt file, and then I discovered Plotly for Python, and I was hooked. Not to make this into an ad for Plotly, but if you have to make any type of graph, chart, table, map, whatever in Python, I highly recommend it. Importing data and making beautiful looking infographics with it was crazy easy. I made a program called SkippyParser.py, that takes a single command line argument, which is the path to the CSV file you want to parse. From there, it generates a plot that shows all of the data logged plotted against time. Below is a read out from a test launch:
Note that data is taken for 10 minutes and a model rocket launch is a fraction of that. The spike you see at the beginning, specifically in the altitude plot, shows you the launch. I included the plot in its entirety just because I like it. You can view the raw CSV here.

Status update: we have a flight computer, and we have a way to parse and display the data. All we need now is a way to get it up in the sky. I kind of jumped the gun by showing you the data from my first test launch, but now I’ll explain the design that went into actually being able to get that data.
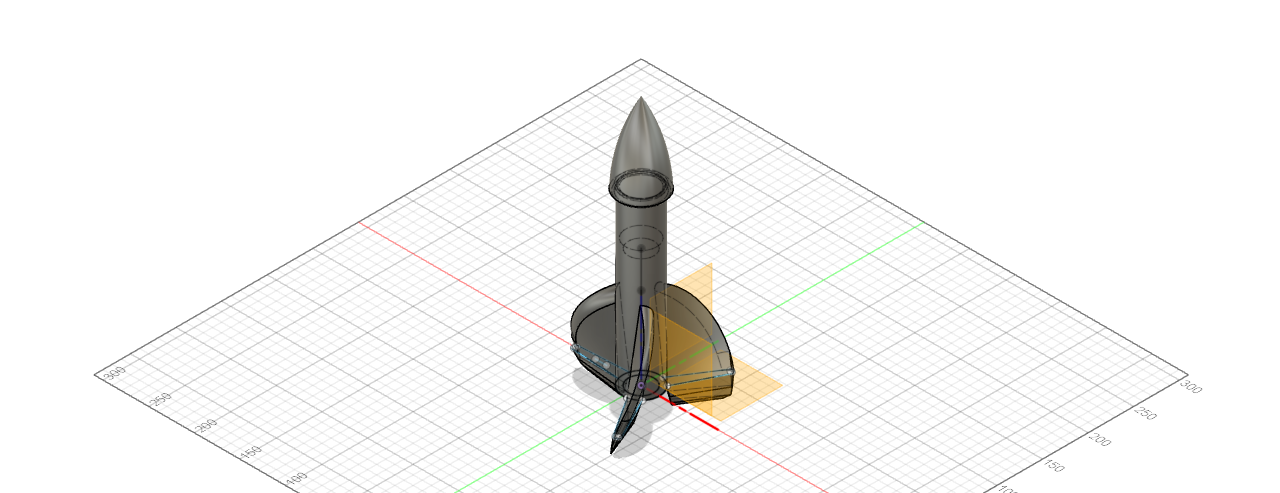
The easiest solution was a 3D printed rocket. I like Fusion, I have a 3D printer, what more is there to ask for? The only foreseeable problem was weight. This thing isn’t heavy per se, but it’s definitely not the helium of the periodic table if you catch my drift. Prior to this, I’ve always used C-6-5 or C-6-7 Estes motors. The first number indicates Newtons of thrust, and the second number indicates the time in seconds until the ejection charge goes off after the rocket is initially launched. On a recent trip to a local hobby store, I looked for the biggest motors they had, which with C-11-0’s, or C size motors with 11 Newtons of thrust, and no ejection charge. They were what was there and they seemed alright, so that’s what I went with. Now with the limitations imposed on my design via the camera, flight computer, and motor size, I set about designing. This is what I came up with:


Just like I am no electrical engineer, I am also no 3D modeling aficionado, but they get the job done. On the left is the base I designed; the motor slips in the bottom and is held in place with a friction fit, and has two guiding holes for the launch rod mounted on the side. On the right is the nose cone, which was a slot to put the camera in, and a slot for the housing for the flight computer, which as of right now is a box with mounting holes. It just gets screwed in with some M2 screws and I slide the whole set up in there. Like I said, it gets the job done. On the bottom of the nose cone is a little loop to secure some type of parachute or streamer; the C-11-0 has no ejection charge but I’m counting on the loose fit of the nose cone to drag it out of the rocket once it starts falling. Thankfully this did actually work. Below is the completed set up, with a jar of skippy for scale:

EFUN 3: X-PLORE
Named for my team at Microsoft because I launched this when my manager came to visit!
As you can see, it’s pretty haphazard, but with some paint it ends up being pretty cute. Unfortunately, both the camera on the ground and the camera on the rocket malfunctioned during this launch, so I have no flight footage. However, it reached about 50 or so meters, as you could see from the data plot above. Nothing great, but alright for a preliminary test, especially since it was so heavy. In the future, I want to design a more compact flight computer housing, and a lighter rocket body. I’m just glad the streamer on the nose cone actually worked; it saved me from having to buy all of these parts again. In version 2 of Project Skippy, I think it would also be fun to add a gyroscope so I could approximate its flight path, as the physics side of Reddit told me doing so with just an accelerometer would not yield usable results. I also need to filter the data, as right now I just read it repeatedly. Anyway, that’s Project Skippy, V1. Thank you for reading! If you have any questions feel free to reach out, or if you end up building your own and improve the design I’d love to see it!