DIY Dual Deployment
2:31 PM on Friday, December 31st, 2021 (Claremont, CA)
It’s the last day of 2021, and of all the fun and antics and projects, one stands out: my introduction into model and high power rocketry. This year, I built two large rockets: Skydiver and Priority Inversion. Both launched successfully, but Priority Inversion’s first launch left some of my goals unattended to after an ejection charge miss-fire the night before my L2 launch delayed the final test of my own system. Due to this, I scrapped my dual deployment system at the time, and just launched with a single-deployment scheme. As the summer came to a close though, the failure of this first system still hung in my mind. There was a large launch coming up in October, known as Midwest Power. The only problem looming in my mind was how I would manage to balance this project with my coursework and club involvement. Thankfully though, I had an out: Purdue’s variable title course system. Here at Purdue, CS majors pick tracks that go along with particular specializations. One of the tracks I am in is called Systems Software, and one of the electives that counts for this track is CS 489 Embedded Systems, which is a project-based class where students can pursue a project of their choosing. Thinking this was perfect, I looked more into it, only to discover the course is no longer offered. While no longer offered, the lead professor of the original class was happy to oversee a one-on-one version of the course with me, which worked out perfectly. So, I extend my sincerest thanks to Professor Comer for advising me on this project and being kind enough to allow me to pursue this project as part of my CS coursework. Initially I created a very ambitious and complex project specification, and while I someday hope to complete that system, this work represents its first iteration that seeks to validate a lot of components and decisions. What follows is an adapted version of my final report that I prepared for Professor Comer.
project objective
Create and program a dual-deployment flight computer that logs in-flight data and can make decisions in-flight to initiate recovery events to bring the rocket safely back down to Earth.
motivation
Prior to this project, I have launched two high power rockets to obtain my HPR certifications. These builds started around May of 2021, and concluded in July of 2021. Both are pictured below:

Skydiver on the Launch Pad
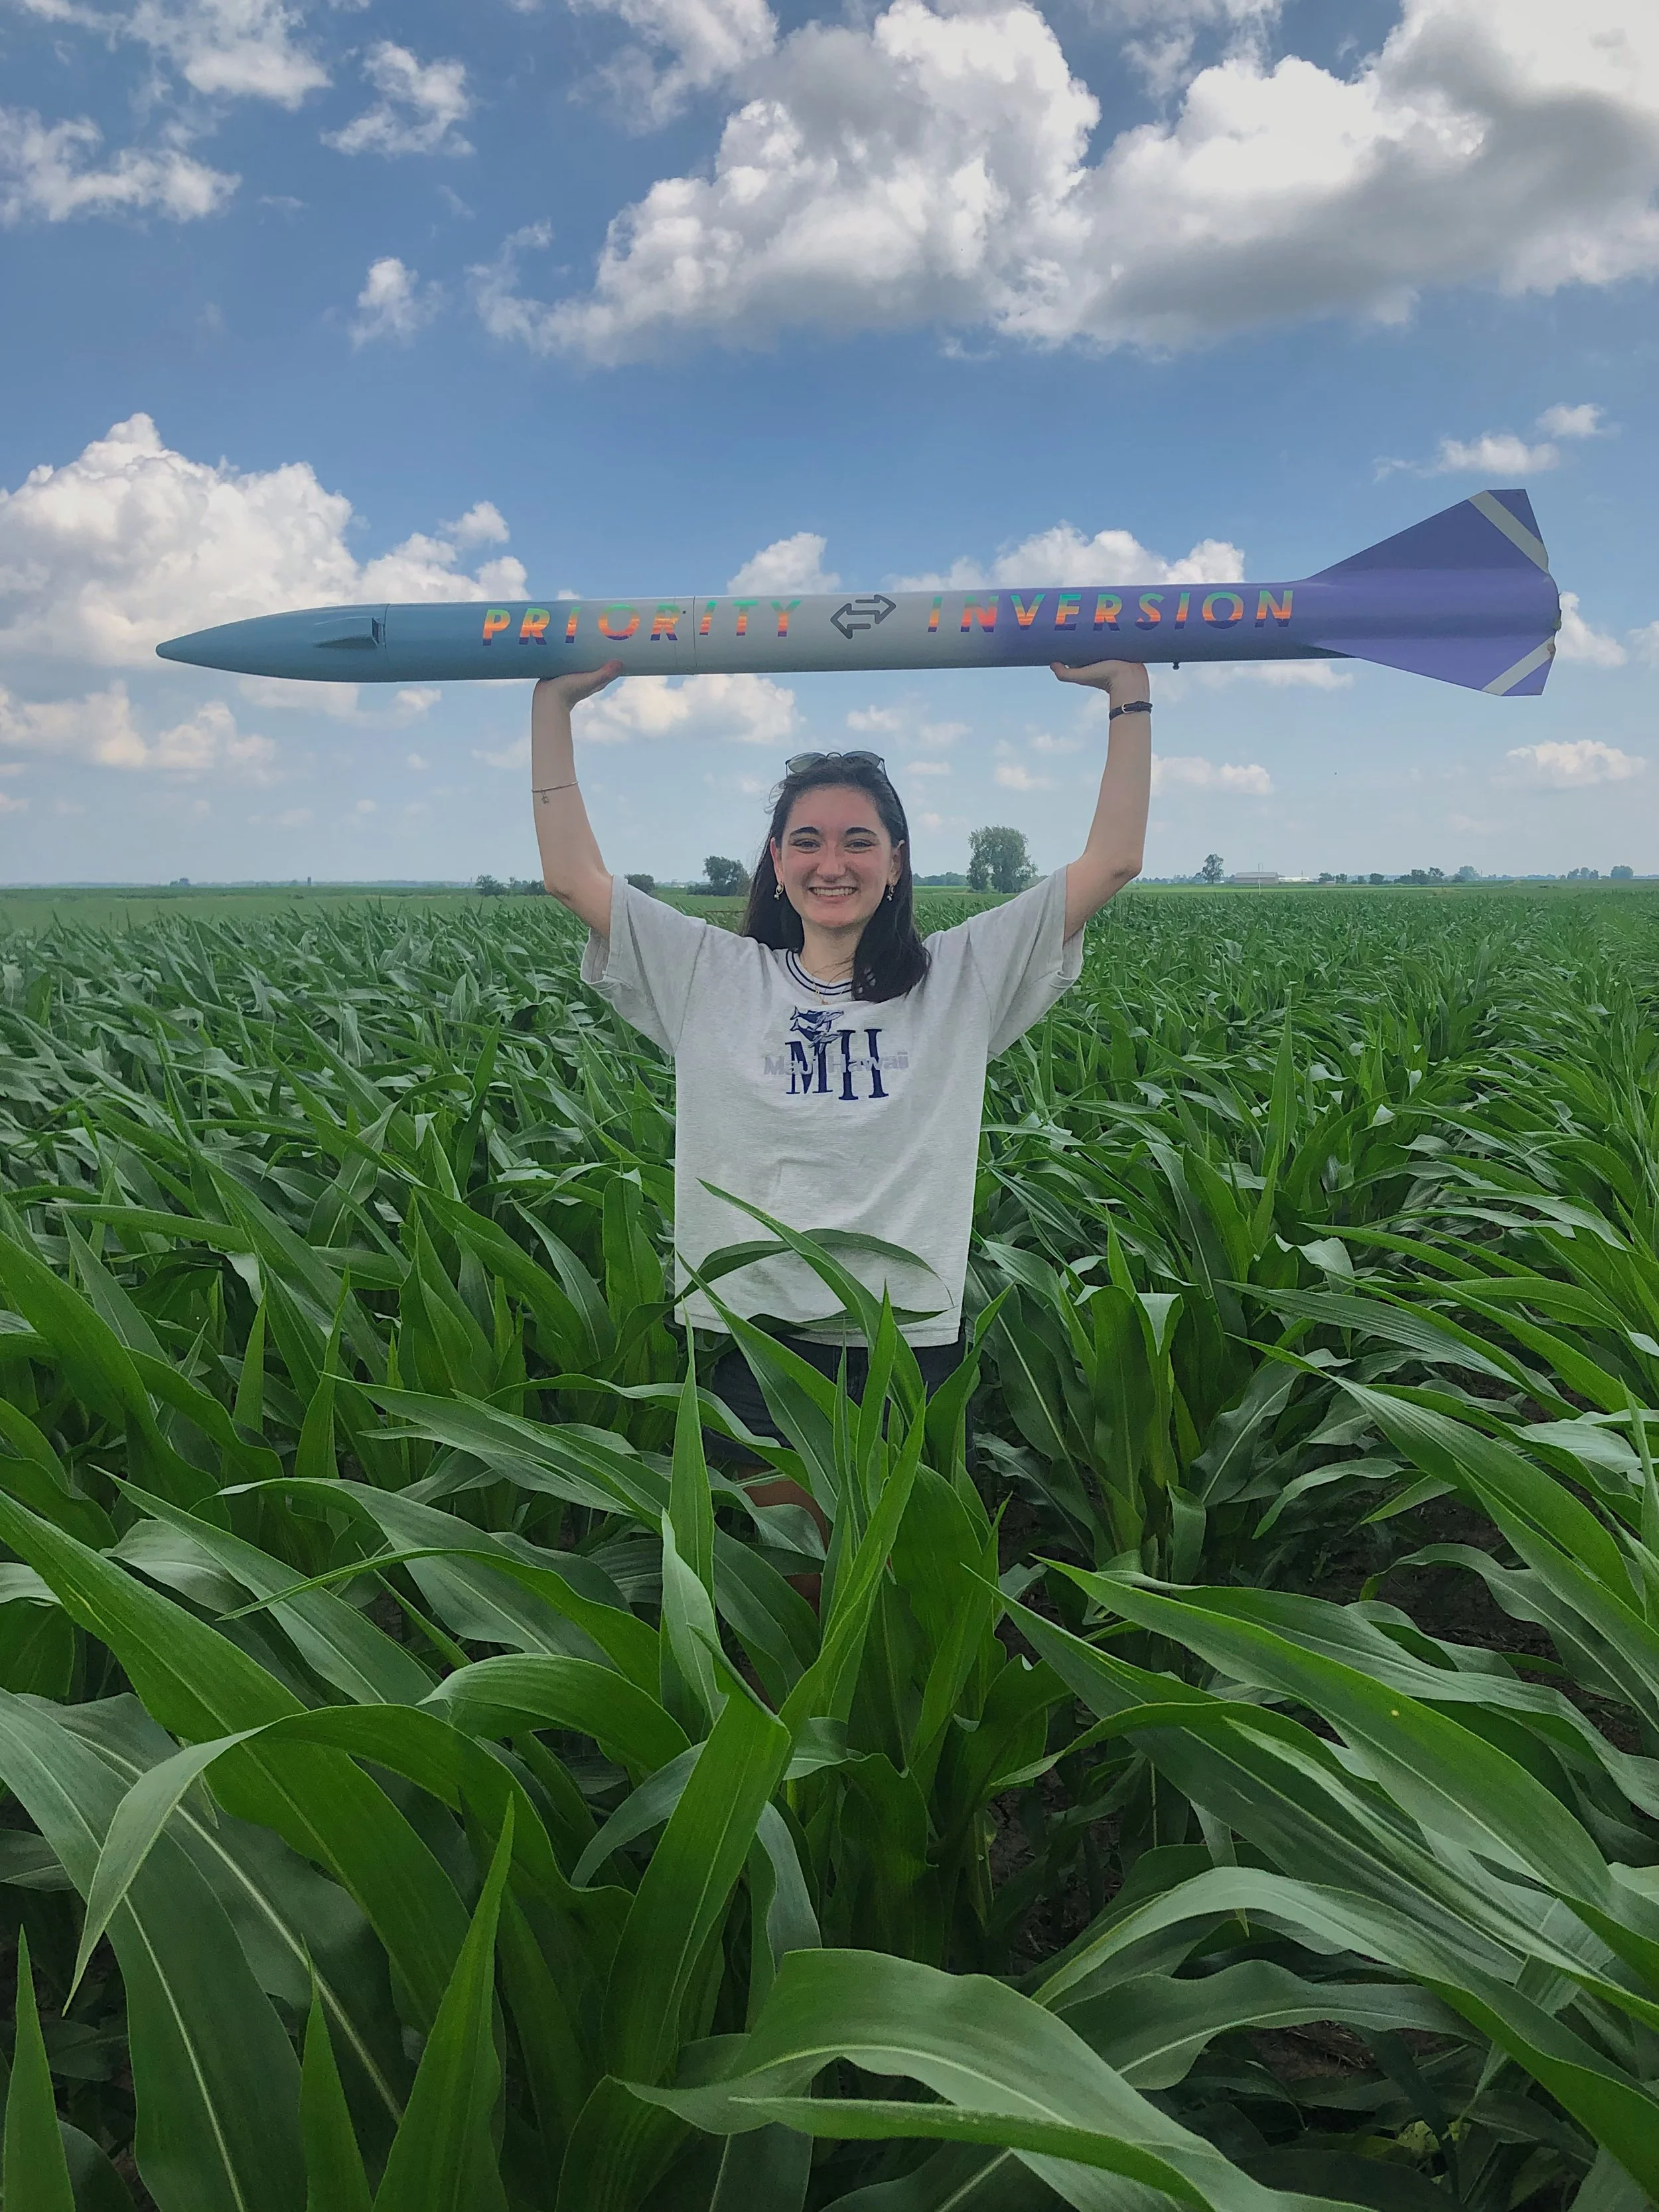
A Successful L2 Launch
The grey rocket, Skydiver, stored a scratch-built camera system along with a data logging system. The camera system was stored in the custom-molded fiberglass nosecone, and is a system that has flown on each of my rockets since. However, vehicle integration of this system has always been a challenge because it has many components and is quite small. The data logging system was stored in the upper airframe and used an Adafruit Feather M0 Adalogger to record measurements from an MPU6050 IMU and a barometric pressure sensor. Both were static systems and recorded for a predetermined amount of time. Once this time expired, both systems stopped logging data. This was precarious in terms of long delays while on the launchpad, because if enough time passed the system would have to be restarted. I still have not decided on a viable solution for this problem; it is easy to cut off some time by detecting when the system has landed, but that still leaves all the time before launch in which the system is logging data. Thankfully powerful and memory-rich components are quite cheap, so this is not a source of serious concern for the current project.
Despite not being the most efficient or well-thought out system, it still recorded some interesting data. Below is the recorded altitude data plotted with Matlab:

Recorded Skydiver Altitude Data
This rocket used a single-deployment recovery scheme, which means it was relatively simple, which is why the descent rate in the plot above is relatively constant. In addition to this, the flight computer acted passively, only taking data measurements and not making any in-flight decisions. Overall though, it was a good introductory project, and a great way to validate the preliminary system as well as the size of the static ports for the avionics bay. Using these measurements and looking at the variation in values, I was able to obtain some preliminary ideas regarding what types of filters I should use on the data to ensure erroneous data points do not cause an unwanted recovery event.
After this flight, I knew I had to take it a step further. I wanted to test different recovery schemes, and I wanted my system to be in charge of deciding when these events happened. So, I set about designing a simple dual deployment flight computer made entirely from breakout boards and an Arduino Uno. This system would fly on my L2 rocket, Priority Inversion, which is pictured above on the right. There was also some extra motivation to do this: before working on your L3, you must prove proficiency in electronic recovery of a rocket by using a flight computer. The key thing here is that most HPR organizations do not specify if the flight computer needs to be store-bought, so a homemade system would suffice. The wiring for this system is pictured below in a Fritzing diagram:

Initial Plans for Priority Inversion's Dual Deployment Flight Computer
This is where the story turns south. The system above was designed for my L2 rocket, Priority Inversion, which was set to launch right before I flew home for a quick break in the summer. This meant I was on a time-critical and accelerated schedule to assemble the system, write the code for it, and test it. I had done all of this, and was testing it the night before the launch when I discovered that the avionics sled I had modeled in Fusion360 and 3D printed did not fit into the rocket, and that there was a faulty connection somewhere, since an ejection charge went off at random during a test. I decided to ground the system, and flew my rocket as single-deploy in order to obtain my certification. Thus, we arrive at the current objective, which is to redeem myself and build a new system that is capable of initiating in-flight recovery events.
System overview
Below are the system objectives:
Log 3-axis acceleration data for the entire flight.
Log 3-axis gyroscope data for the entire flight.
Log altitude data for the entire flight.
Log temperature data for the entire flight.
Play a loud buzzer once the system has stopped logging data.
Be able to sense descent and deploy a main parachute at a specific altitude (using pyrotechnic methods).
hardware
To meet the system objectives, I needed an IMU and barometric pressure sensor in order to log all of my desired data. In addition to this, I needed a buzzer that I can control using a digital signal to play a noise once the system has finished its function. Finally, I needed a way to provide a high voltage and current to an e-match that would ignite the black powder ejection charge. Thus, based on these requirements, I settled on the following components:
10k Ohm Resistors
220 Ohm Resistors
LED
Slide Switch
SD Card
The diagram below shows the wiring for the system. The four wires extending off the right side of the screen denote the connections for the Grove 10dof IMU module; it just requires power and an I2C connection. Standard colors are used for power wires, with yellow denoting a single signal wire, blue denoting an SDA line, and green denoting an SCL line. Note that these connections are the same ones referenced in the code. The switch and LED were initially meant to be part of an arming system, but the components and loose wires did not lend themselves to an easy integration solution. Due to this, in the final design they were omitted, but in the future an important requirement for me is that the system is able to be turned on or armed once it is already fully integrated into the rocket.

Dual Deployment Flight Computer Hardware Arrangement
The key thing to note here is that by picking the Adalogger and the Grove 10dof IMU, I was able to drastically reduce the number of required breakout boards from the last iteration because these systems had desired features either built-in, or coupled with one another.
For the complete system, I utilized perfboard and headers to construct a plug-and-play system that held and connected all of the breakout boards. This just required simple soldering and was straight-forward to put together.
software
The software for this project ended up being pretty simple. Initially, I had formulated a complex state system in which the flight computer would use sensor data to detect state transitions from say, apogee to drogue descent. This however was hard to validate, and since I had never flown these sensors before I actually had no way to robustly validate the entire state flow. Because of this, I decided to go with a much simpler approach, that follows the following logic:
The system is turned on, initializes sensors, plays a success sound, and begins logging data.
Once an altitude above 350 meters is detected, the system arms itself. The system continues logging data.
Once an altitude below 250 meters is detected and the system is armed, the computer sends the signal to provide high voltage to the e-match, thus ejecting the parachute.
The system continues logging data until 60 minutes has passed from the time it began logging data.
Once this time threshold has been passed, a beeping pattern is played on the buzzer until the system is forcibly turned off.
The code for this system is given below:
#include <SD.h>#include "Wire.h"#include "I2Cdev.h"#include "MPU9250.h"#include "BMP280.h"#define cardSelect 4#define dualDepArmAlt 350 // at 350 meters, arm the dual deploy system (10 for test)#define mainDeployAlt 250 // at 250 meters, deploy the drogue (5 for test)#define buzzerPin 10#define relayPin 9MPU9250 accelgyro;I2Cdev I2C_M;BMP280 bmp280;float Axyz[3];float Gxyz[3];int16_t ax, ay, az;int16_t gx, gy, gz;int16_t mx, my, mz;File logfile;char filename[20];float dataLoggingStartTime;float baseAltitude;// data definitionsfloat currentTime; // secondsfloat pressure; // pascalsfloat altitude; // meters, relative not absolutefloat temperature; // degrees Cfloat xAcceleration; // gfloat yAcceleration; // gfloat zAcceleration; // gfloat xGyro; // deg/sfloat yGyro; // deg/sfloat zGyro; // deg/sfloat totalAccel; // gfloat filtAlt = 0.0; // meters, relative not absolutefloat movMean[5] = { 0.0 }; // buffer used for moving mean calculationsboolean dualDepArmed = false;int numMins = 75;int loggingTime = 60 * numMins;// initialize all systems void setup() { Wire.begin(); Wire.setClock(400000); // set initial flight state dualDepArmed = false; // set buzzer to silent pinMode(buzzerPin, OUTPUT); digitalWrite(buzzerPin, HIGH); // the board signal is inverted // set relayPin to output pinMode(relayPin, OUTPUT); disableRelay(); // initialize moving mean array for (int i = 0; i < 5; i++) { movMean[i] = 0.0; } initFile(); initTenDOF(); getBaseMeasurements(); // signal success visually and audibly pinMode(LED_BUILTIN, OUTPUT); digitalWrite(LED_BUILTIN, HIGH); playSuccess();}// initialize the 10dof IMUvoid initTenDOF() { accelgyro.initialize(); if(!accelgyro.testConnection()) { exitFailure(); } if (!bmp280.init()) { exitFailure(); }}// initialize a new file to write tovoid initFile() { if (!SD.begin(cardSelect)) { exitFailure(); } // create a unique file name strcpy(filename, "/FLIGHT00.csv"); for (uint8_t i = 0; i < 100; i++) { filename[7] = '0' + i/10; filename[8] = '0' + i%10; if (! SD.exists(filename)) { break; } } logfile = SD.open(filename, FILE_WRITE); if(!logfile) { exitFailure(); } logfile.println("time(sec),pressure(pa),altitude(m),temperature(C),xAcceleration(g)," + "yAcceleration(g),zAcceleration(g),totalAcceleration(g),xRot(deg/s),yRot(deg/s)," + "zRot(deg/s),filtAlt(m)");}void closeFile() { logfile.close();}void exitFailure() { playError(); while(true) { delay(10); }}// log all flight datavoid logData() { // get data currentTime = (float)(millis() - dataLoggingStartTime) / 1000.0; getAccelData(); getGyroData(); totalAccel = sqrt(pow(xAcceleration, 2) + pow(yAcceleration, 2) + pow(zAcceleration, 2)); temperature = bmp280.getTemperature(); pressure = bmp280.getPressure(); altitude = bmp280.calcAltitude(pressure) - baseAltitude; // do the moving mean calculation float sum = altitude; for (int i = 0; i < 4; i++) { sum += movMean[i + 1]; movMean[i] = movMean[i + 1]; } movMean[4] = altitude; filtAlt = sum / 5.0; // log data logfile.print(currentTime); logfile.print(","); logfile.print(pressure); logfile.print(","); logfile.print(altitude); logfile.print(","); logfile.print(temperature); logfile.print(","); logfile.print(xAcceleration); logfile.print(","); logfile.print(yAcceleration); logfile.print(","); logfile.print(zAcceleration); logfile.print(","); logfile.print(totalAccel); logfile.print(","); logfile.print(xGyro); logfile.print(","); logfile.print(yGyro); logfile.print(","); logfile.print(zGyro); logfile.print(","); logfile.print(filtAlt); logfile.print('\n');}// get base measurements to calculate relative altitudevoid getBaseMeasurements() { float runningAlt = 0.0; for (int i = 0; i < 15; i++) { temperature = bmp280.getTemperature(); pressure = bmp280.getPressure(); altitude = bmp280.calcAltitude(pressure); runningAlt = runningAlt + altitude; delay(250); } baseAltitude = runningAlt / 15.0; dataLoggingStartTime = millis(); logfile.print(dataLoggingStartTime); logfile.print(","); logfile.print(" "); logfile.print(","); logfile.print(baseAltitude); logfile.print(","); logfile.print(" "); logfile.print(","); logfile.print(" "); logfile.print(","); logfile.print(" "); logfile.print(","); logfile.print(" "); logfile.print(","); logfile.print(" "); logfile.print(","); logfile.print(" "); logfile.print(","); logfile.print(" "); logfile.print(","); logfile.print(" "); logfile.print(","); logfile.print(" "); logfile.print('\n'); altitude = 0.0;}// main code loopvoid loop() { logData(); // check altitude for arming if (filtAlt > dualDepArmAlt) { dualDepArmed = true; } // once armed, check for deployment if (filtAlt < mainDeployAlt && dualDepArmed) { ejectMainChute(); } // record data for x minutes, otherwise enter recovery mode if (currentTime >= loggingTime) { logfile.close(); playSuccess(); digitalWrite(LED_BUILTIN, LOW); disableRelay(); enterRecoveryMode(); } delay(250);}// 3 beeps for errorvoid playError() { for (int i = 0; i < 3; i++) { playBuzzer(500); delay(500); }}// 2 beeps for successvoid playSuccess() { for (int i = 0; i < 2; i++) { playBuzzer(1000); delay(500); }}// consistent beeping for loop exitvoid enterRecoveryMode() { while (true) { playBuzzer(50); delay(50); }}// helper function to play a beepvoid playBuzzer(int milliseconds) { digitalWrite(buzzerPin, LOW); delay(milliseconds); digitalWrite(buzzerPin, HIGH);}// abstraction to eject the main chutevoid ejectMainChute() { digitalWrite(relayPin, HIGH);}// abstraction to disable the relayvoid disableRelay() { digitalWrite(relayPin, LOW);}// helper function to get acceleration datavoid getAccelData() { accelgyro.getMotion9(&ax, &ay, &az, &gx, &gy, &gz, &mx, &my, &mz); xAcceleration = (double) ax / 16384; yAcceleration = (double) ay / 16384; zAcceleration = (double) az / 16384;}// helper function to get gyroscope datavoid getGyroData() { accelgyro.getMotion9(&ax, &ay, &az, &gx, &gy, &gz, &mx, &my, &mz); xGyro = (double) gx * 250 / 32768; yGyro = (double) gy * 250 / 32768; zGyro = (double) gz * 250 / 32768;}vehicle integration
Based on prior experiences with other systems and rockets, I wanted to be sure integration of the flight computer was as simple as possible. To do this, I designed a 3D printed avionics sled that holds all of the sensors, PCBs, and batteries required for the system. This sled then slides into a cylindrical housing that is perfectly sized to fit within the avionics bay on the rocket and be secured in place with two threaded rods. The idea is that I can slide the avionics sled into the cylindrical holder, and then slide the cylindrical holder into the avionics bay of the rocket, and secure it using threaded rods, nuts, and a plywood bulkplate. This ended up working out very nicely, with the only hiccup being the threading of the ejection charge wires into the avionics bay. Below is the CAD model of the avionics sled in place in the cylindrical holder. This is the design I 3D printed and flew on Priority Inversion. Overall I think it worked well in that it was easy to integrate. In the future though, I would add more holes so the pressure in the avionics bay would equalize more evenly.
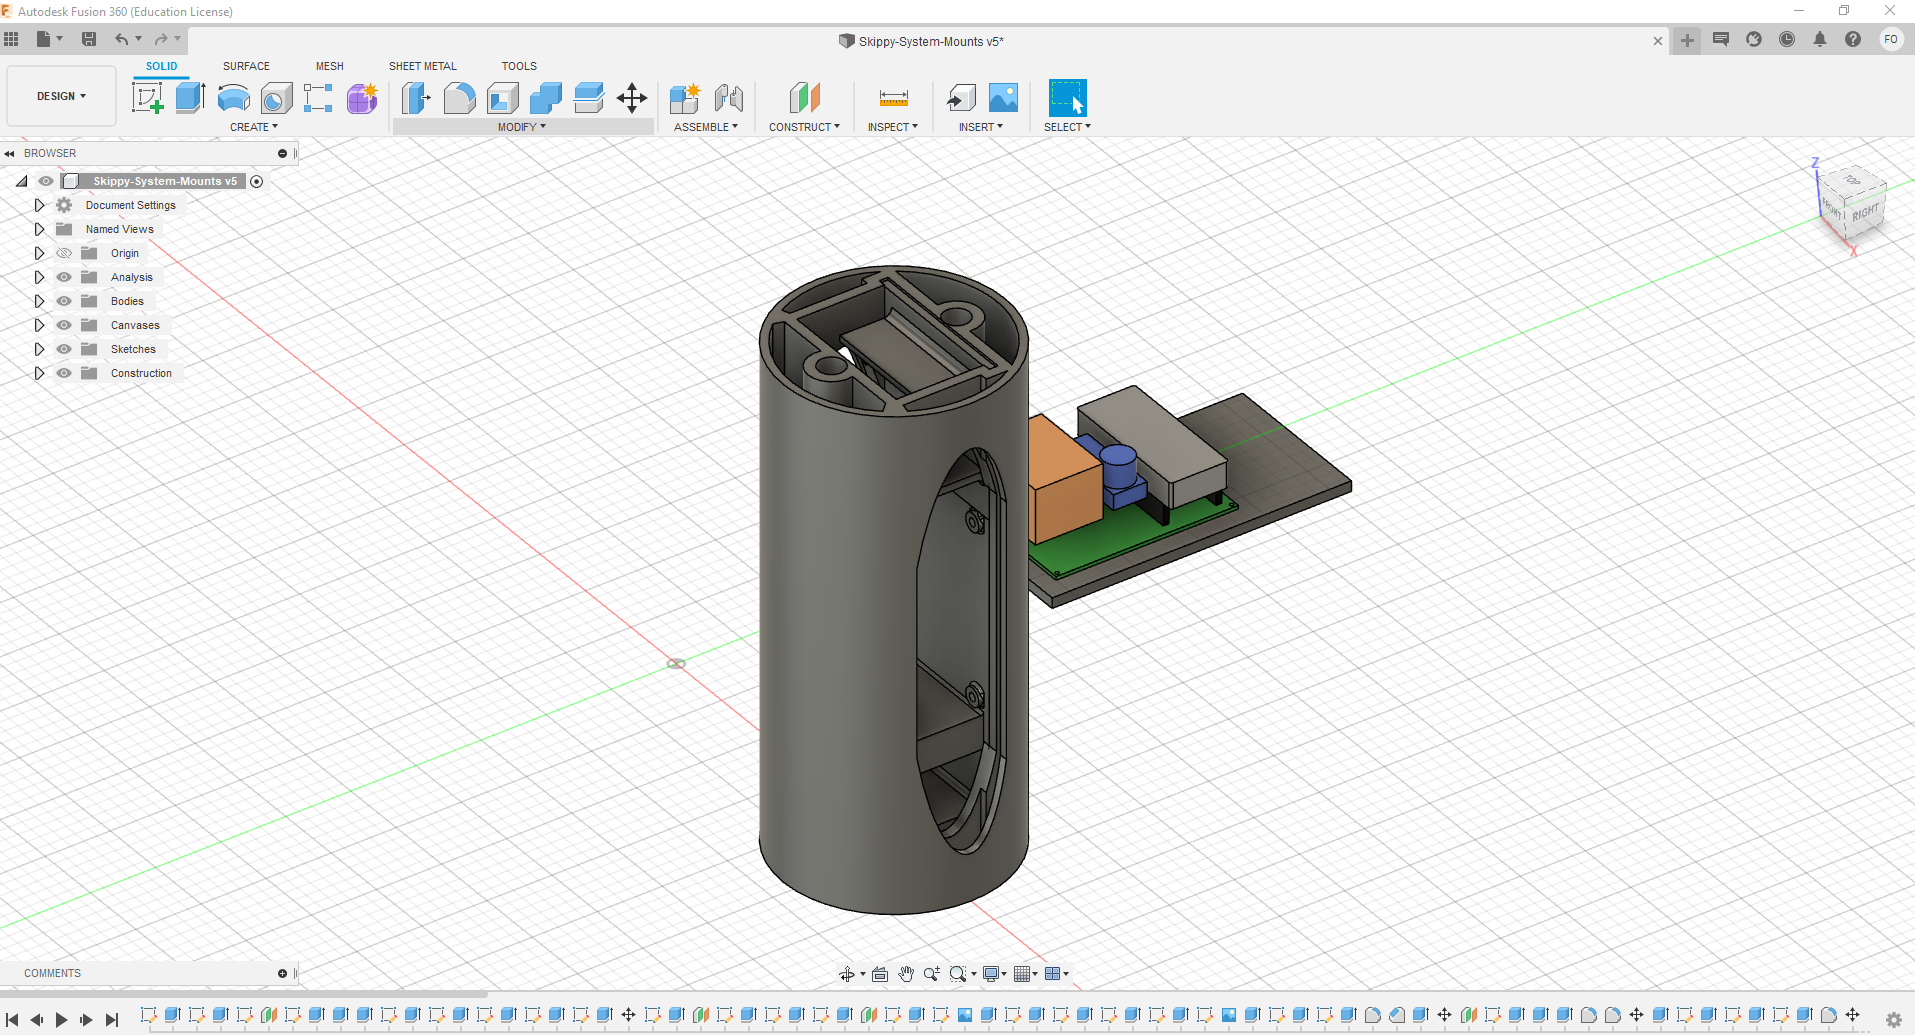
Avionics Sled in Housing (Fusion 360)
system testing
A critical question in my mind was how one should go about validating a system before flight. I had a lot of motivation to make sure this flight went as smoothly as possible: if it did not operate as expected I stood to lose around $1000 dollar's worth of time, hardware, and propellant when considering the entire launch vehicle. My biggest concerns were:
Will the circuit have enough power to ignite the black powder charge that ejects the main parachute?
Will the circuit be able to respond to incoming sensor data and make the decision to ignite the black powder? And can it do this reliably?
Thus, I focused on the two forms of testing below:
Ejection Testing
First, I started by addressing the first concern because it was a simple test to perform. I wrote some simple code such that once the system was armed, it would wait 45 minutes and then send the signal to ignite the black powder, with the idea being that I can use that 45 minutes to integrate the assembly into the vehicle. It didn't take nearly that long, but I wanted to be on the safe side because I was working with an energetic material. In hindsight, there was a smarter way I could've done this as having the whole thing be timed made integration feel like defusing a bomb. As I'll discuss later, the next step is telemetry, and using that radio connection point, I could have sent a remote signal to ignite the charge. This would be a lot easier and make vehicle integration a lot less stressful. Note that this stress is just a problem for tests; in the actual program, the flight computer does not arm itself until it passes a certain altitude.
This test was also interesting because it helped me find the required amount of black powder needed to eject the nose cone and parachute. I found that about one finger-tipful of black powder compacted into a latex glove did the trick. In hindsight I would've also remembered to bring my scale to determine how many grams this was, but we live and we learn. The test went off without a hitch, and the fact that the system could trigger a powerful enough ejection charge was verified. Below are some photos from the backyard ejection test:
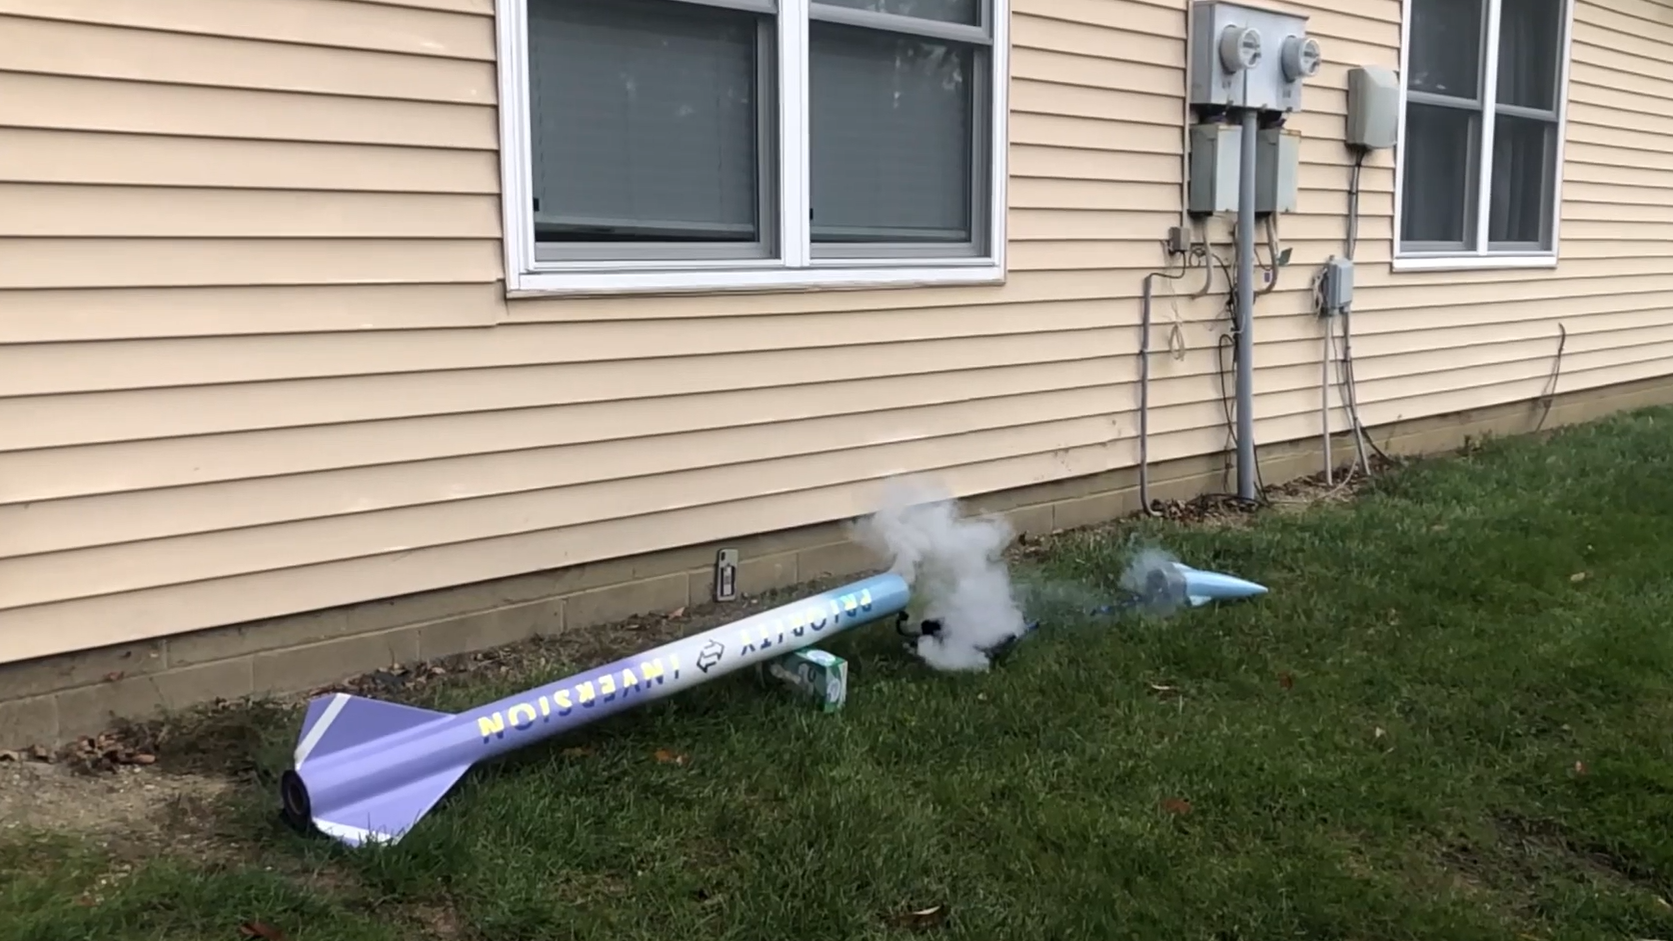
A Backyard Ejection Test (Wide View)
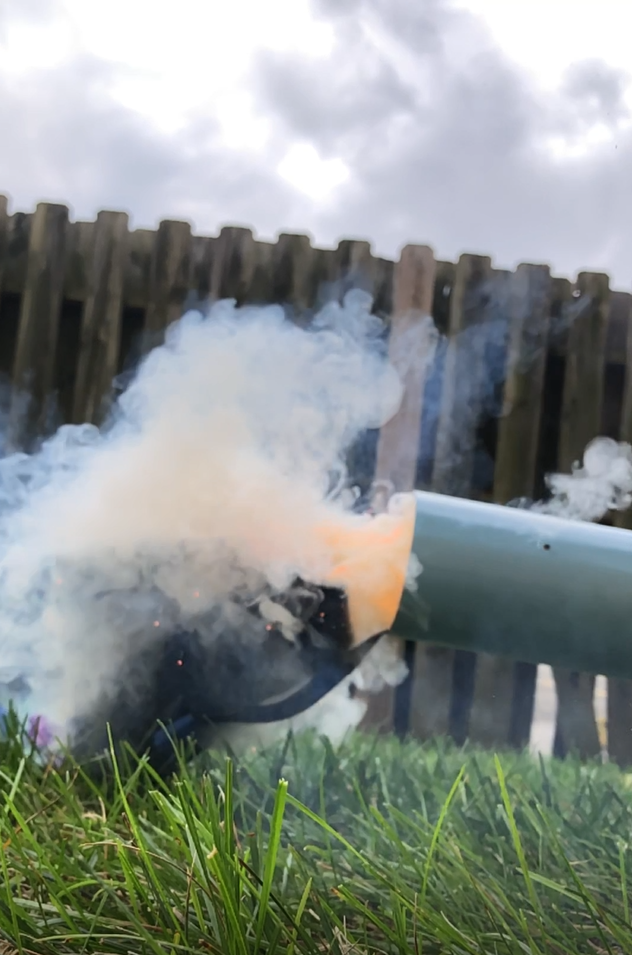
A Backyard Ejection Test (Up Close)
Simulated Flight Testing
To address the second concern, I now had to figure out a way to validate that the flight computer would perform as expected during a proper flight. The problem with this is that a rocket launch of this magnitude costs around $200 in terms of propellant and registration, and a total of 6 hours of driving. So, I had to come up with a more cost-effective way to test the system than in-flight. A couple thoughts came to mind: use a drone to simulate the flight, suspend the flight computer from a parking garage with a rope, or just walk up and down the stairs with the flight computer. I settled on the last option because it was easy to perform, and I was running out of time and needed to conduct a lot of tests.
To conduct these tests, I wrote an adapted version of my program so that the arming altitude and deployment altitude made sense for my apartment building. This meant that once I surpassed 10 meters, the flight computer would arm, and then once I passed below 5 meters (relative altitude), it would 'deploy' the parachute by lighting up an indication LED. After this, I walked up and down the stairs, starting at my apartment, going to the roof, and going back down and ensuring the LED lit up at the right moment. It wasn't the most robust way to test, but it was enough for me to feel confident my system would perform as expected. With the system validated, now I just needed to ensure the static ports in the rocket were large enough so the barometric pressure in the avionics bay would equalize at a rate such that the sensor measurements are not off. To do this I calculated the size of holes I needed based on the volume of the avionics bay. Below is a picture of the fully integrated avionics sled in the stairwell of my apartment during one of the tests:
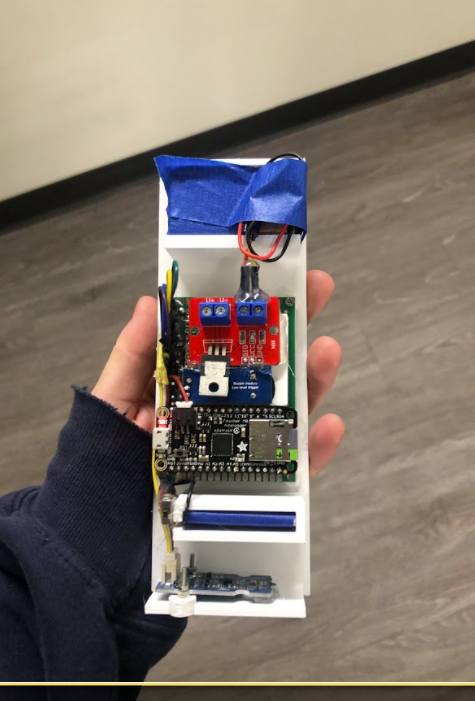
The Fully Integrated Avionics Sled
Camera System
In addition to the flight computer controlling the deployment events on the rocket, I also opted to include a camera system. This is a system I have validated in the past on two other HPR flights, so I had little to do with respect to the system besides assemble it and house it in the nosecone.
Below is a diagram that shows all of the wiring for the camera system. It is very simple, and just consists of a Raspberry Pi, LiPo battery, power regulator and battery charger, toggle switch, and indication LED.
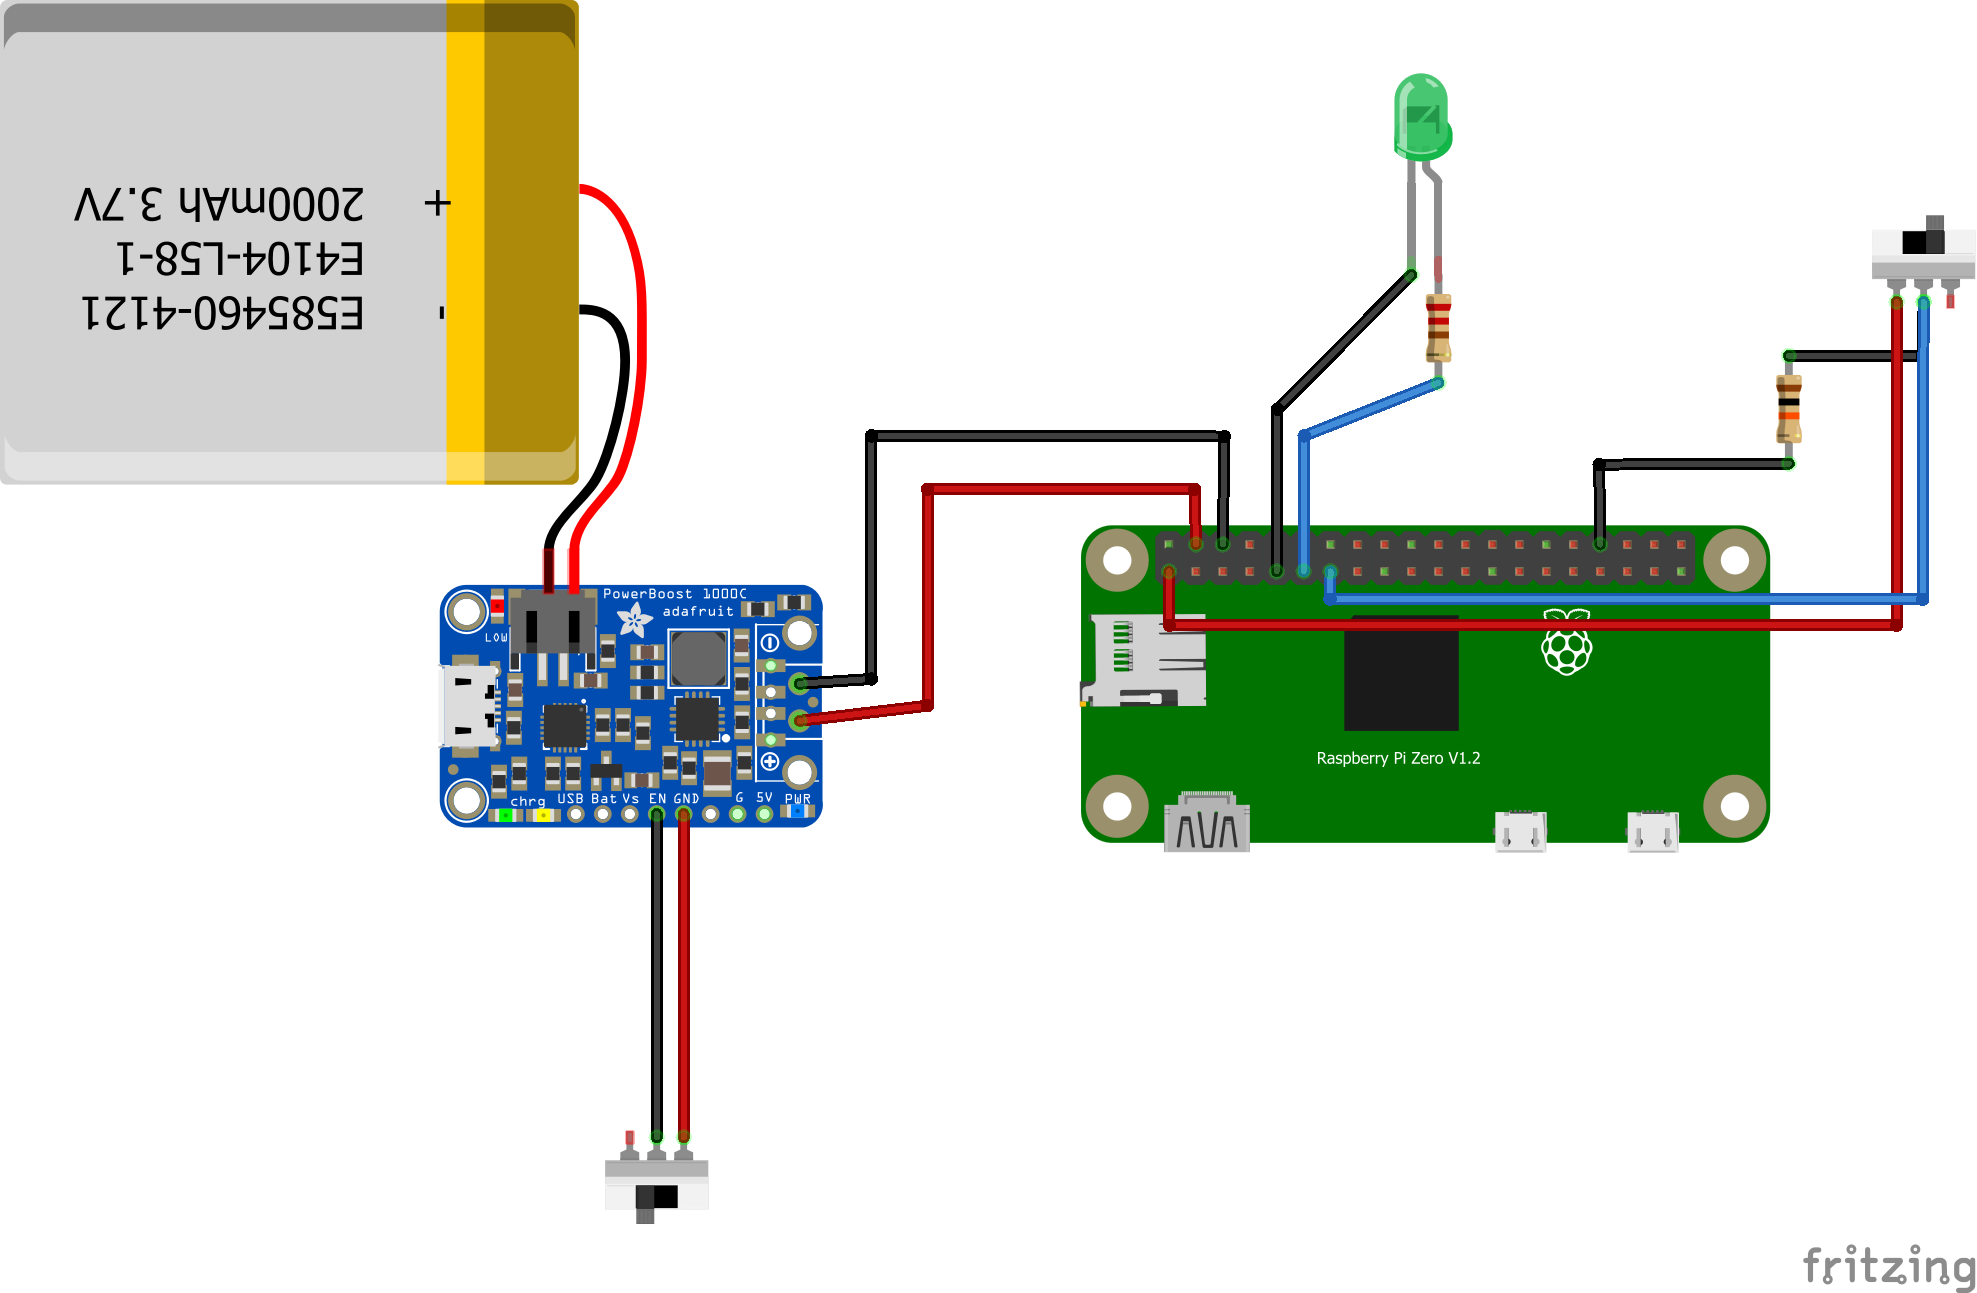
Wiring for the Raspberry Pi Camera System
The code the system operates on is given below. The Raspberry Pi runs this script when it boots. The script then creates a new launch filename, and waits until a switch is toggled. Once that switch is toggled, it lights up an indication LED, and records a video for 45 minutes. In the future I would like this code to also be dependent on flight status, but at the moment it just operates statically with respect to its surroundings.
# Frances O'Leary 23/05/2021import RPi.GPIO as GPIOfrom time import sleepfrom picamera import PiCameraimport os# initialize pins for switch and status LEDGPIO.setwarnings(False)GPIO.setmode(GPIO.BOARD)GPIO.setup(11, GPIO.OUT, initial=GPIO.LOW)GPIO.setup(13, GPIO.IN, pull_up_down=GPIO.PUD_DOWN)# setup camera and choose unique filenamecamera = PiCamera()files = next(os.walk('/home/pi/Launches/'))[2]filename = '/home/pi/Launches/Launch_' + str(len(files)) + '.h264'# logic for switchinit_state = GPIO.input(13)# check for switch to change state, then record for 45 minuteswhile True: if GPIO.input(13) != init_state: GPIO.output(11, GPIO.HIGH) camera.start_recording(filename) GPIO.output(11, GPIO.HIGH) camera.wait_recording(45 * 60) camera.stop_recording() GPIO.output(11, GPIO.LOW) exit()Launch simulation and expected flight profile
To make sure pertinent parameters in my code such as the arming altitude and main deployment altitude were correct, I recreated my rocket in OpenRocket, which is an open-source rocket simulation program. A screen shot of the simulated vehicle is given below:
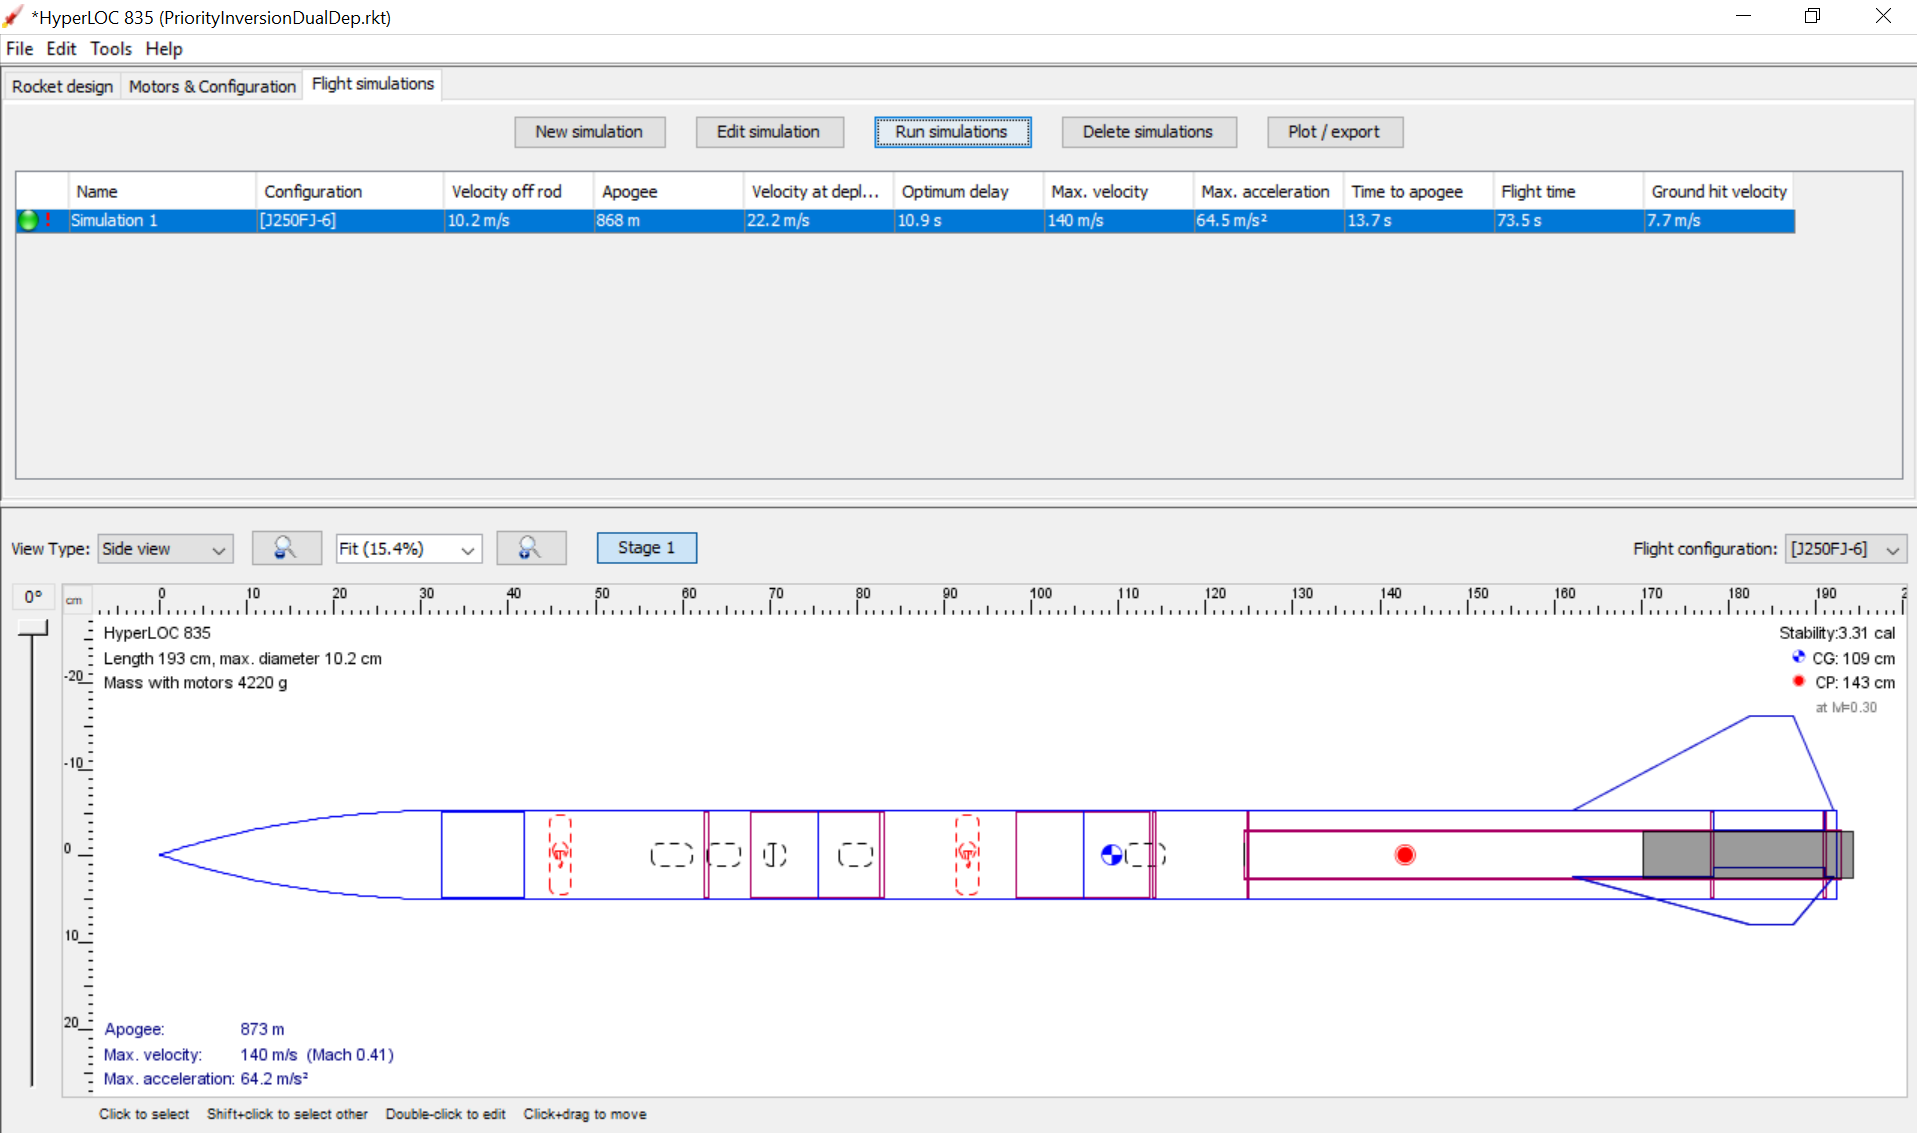
Simulated Launch Vehicle
Some key things to note about this program are that it allows for a way to verify stability of the launch vehicle by comparing the center of mass and the center of pressure. So long as the center of mass is forward of the center of pressure, the rocket is said to be 'stable'. So, from the image above, we can see that the vehicle is stable.
The second key feature of OpenRocket is that it allows you to simulate flights using different motors, parachutes, and deployment schemes. So, for my simulation I could place a J250 Aerotech DMS motor in the rocket, and see what would happen if the 18 inch drogue parachute deployed at apogee, and the 48 inch main parachute deployed at 250 meters above the ground (as the flight computer is expected to do). This gives me the following plot on the next page:
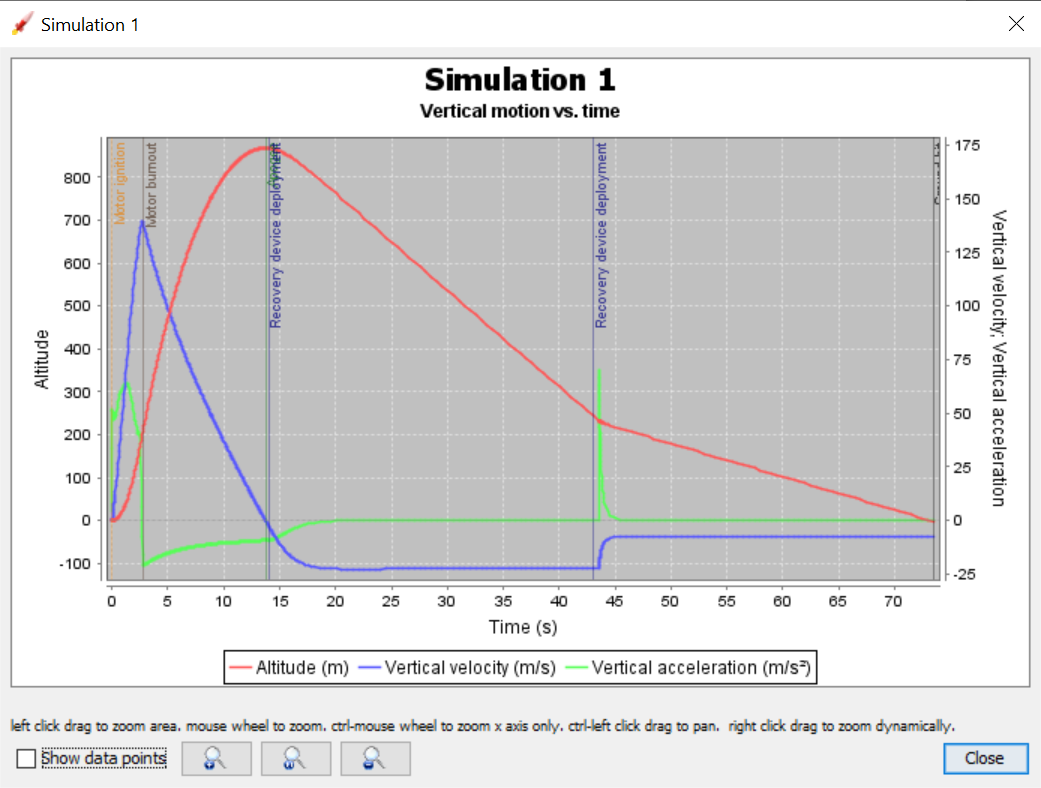
Simulated Launch Profile on a J250 DMS Motor with Dual Deployment
Some things to note are the following key calculations:
Velocity off of the rod: 10.2 m/s
Apogee: 868 meters
Velocity at deployment: 22.2 m/s
Optimum delay: 10.9 s
Maximum velocity: 140 m/s
Maximum acceleration: 64.5 m/s^2
Time to apogee: 13.7 s
Flight time: 73.5 s
Ground hit velocity: 7.7 m/s
All of these numbers look nominal, so we can validate our choice of parachutes. Additionally, the time to apogee is projected to be 13.7 seconds. This is a key number to note because during the first flight of the flight computer, it will only control one parachute ejection: main. This means that we will depend on the DMS motor's ejection charge to eject the drogue parachute at apogee, which means that the delay on the motor must match the projected time to apogee. The default delay on the motor is 14 seconds, and you can only take off 2 second increments using the standard drill delay tool, which means I will not have to adjust the motor.
The plot above also shows a nominal flight profile, with a strong ascent, apogee, drogue descent, and then main descent to the recovery phase. The forces on the vehicle, which were projected to be a maximum of 6.58 g's are also capable of being withstood by the vehicle during ascent and the shock cords upon main deployment. Thus, since the simulation also shows the expected outcome if the flight computer were to work as expected, I cleared my system for flight.
Launch Information
Launch Date -Saturday October 30th, 2021
Launch Time - 11:29 AM EDT
Launch Site Coordinates - (41.488167, -89.500766)
Highest Recorded Temperature - 60 degrees F
Lowest Recorded Temperature & 48 degrees F
Average Day Temperature & 53.44 degrees F
Launch Temperature & 56 degrees F
Dew Point & 45.24 degrees F
Wind & 7 MPH
Wind Gust & 0 MPH
Sea Level Pressure & 29.12 Hg
Cloud Ceiling & sparse and breaking at 3000 ft
Motor & Aerotech J250 DMS 14A
Drilled Delay & 14 seconds
flight analysis
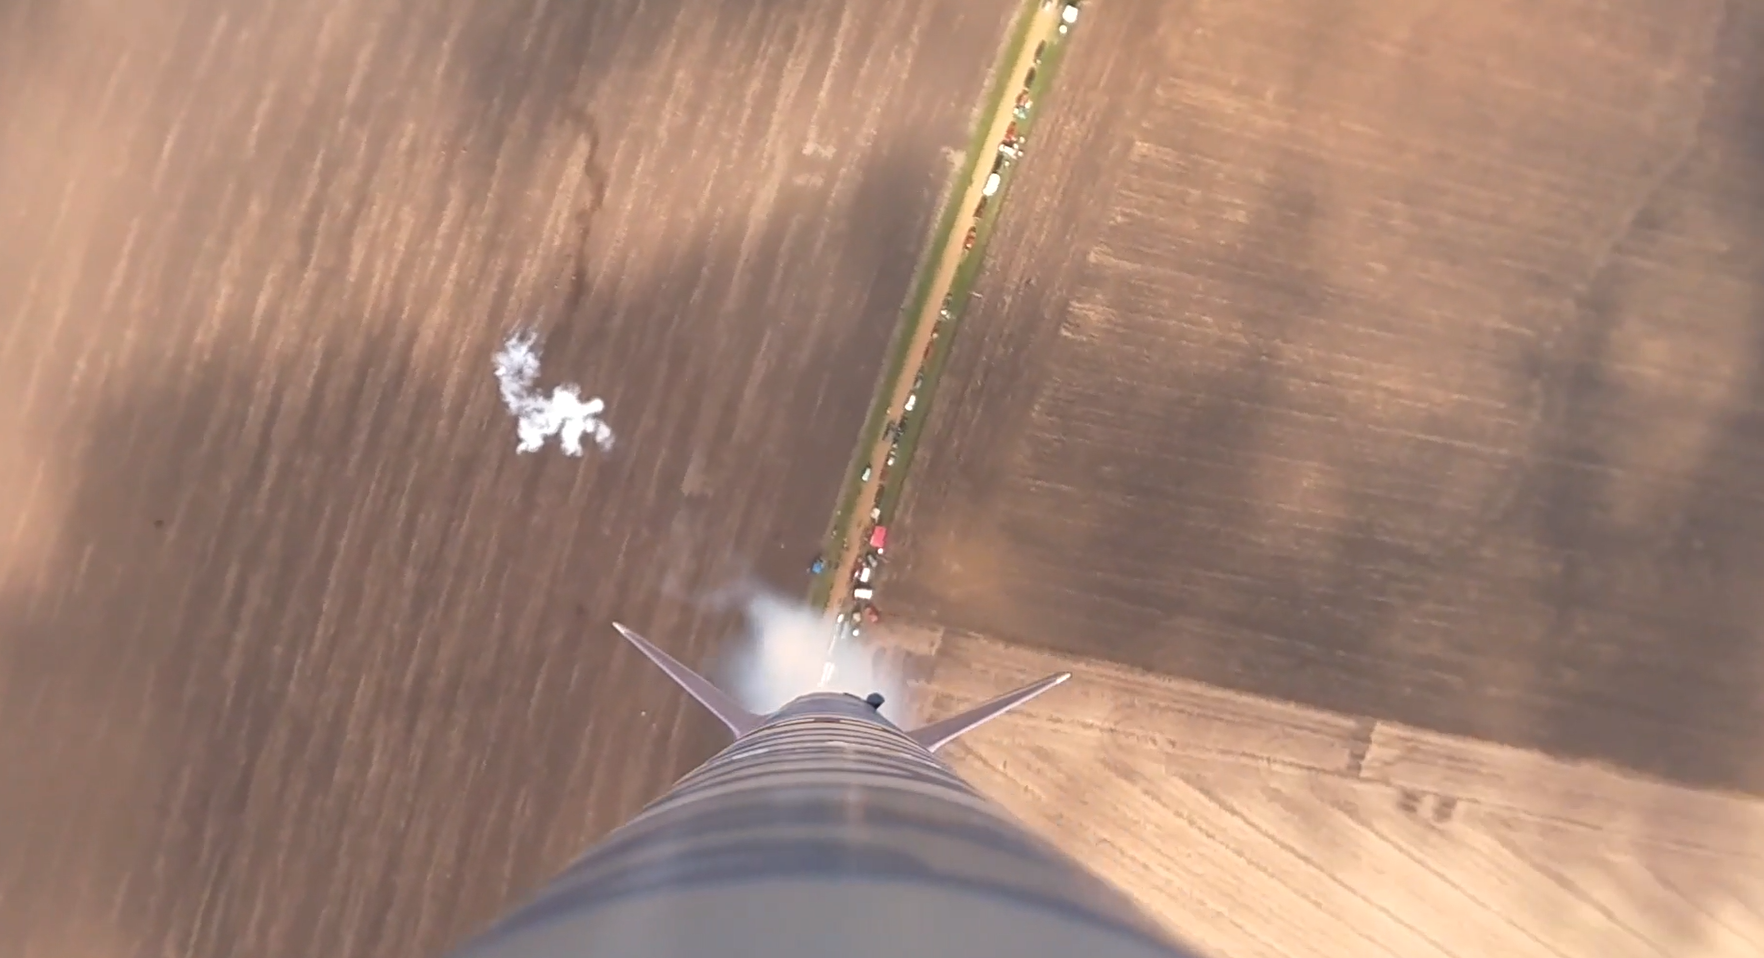
Overall, the flight was a success with some interesting events. The full onboard camera footage can be viewed below:
The launch day was quite cold and a little windy, as you can note from the launch day data in the table above. That morning, there was some pretty low cloud cover that thankfully cleared out quickly so that I could launch (you can however see the shadows of the clouds on the cornfields below in the video). Ascent was clean and smooth; the rocket appeared to go straight up. The footage shows that quite a quick roll rate was achieved on ascent, most likely due to wind. I've ruled out misaligned fins as the cause because I have footage from a prior launch of this rocket with minimal roll on a day with nearly no wind. A snapshot from the onboard camera just after motor burnout is shown below along with a picture from the ground:
Ascent Still Image from the Onboard Camera System
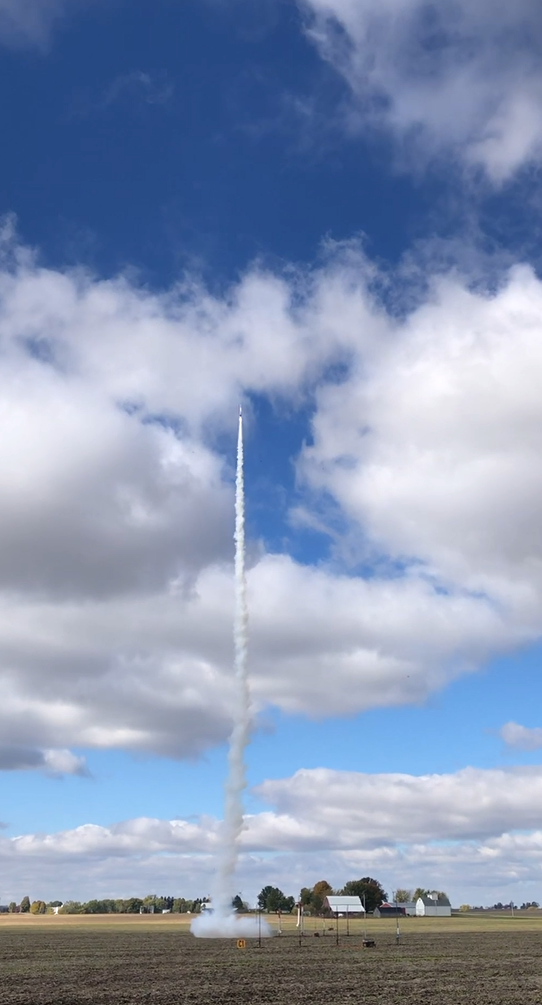
Launch as Viewed from the Ground
Once motor burnout occurred, the rocket continued to coast upwards. From the onboard footage though, it appears as if the 14 second delay was actually a bit shorter than that. This caused the drogue parachute to be deployed while the rocket is still ascending, and not yet at apogee. This abruptly stopped the rocket, but wasn't catastrophic because the rocket was already slowing down and close to apogee. This is another reason that a flight computer than can automatically detect apogee in order to deploy the drogue parachute is desirable. At this point in time, the x-form 18 inch drogue parachute came out, and the rocket began to fall back to Earth, now in two connected pieces.
The following image shows the rocket in this state. You can see the kevlar shockcord that connects the booster section to the upper airframe and has the drogue parachute (red) and fireproof blanket (black) secured to it. The booster hangs above the system, and the bits floating around it are little bits of biodegradable insulation that are packed with the drogue parachute to prevent it from becoming charred due to the ejection charge.
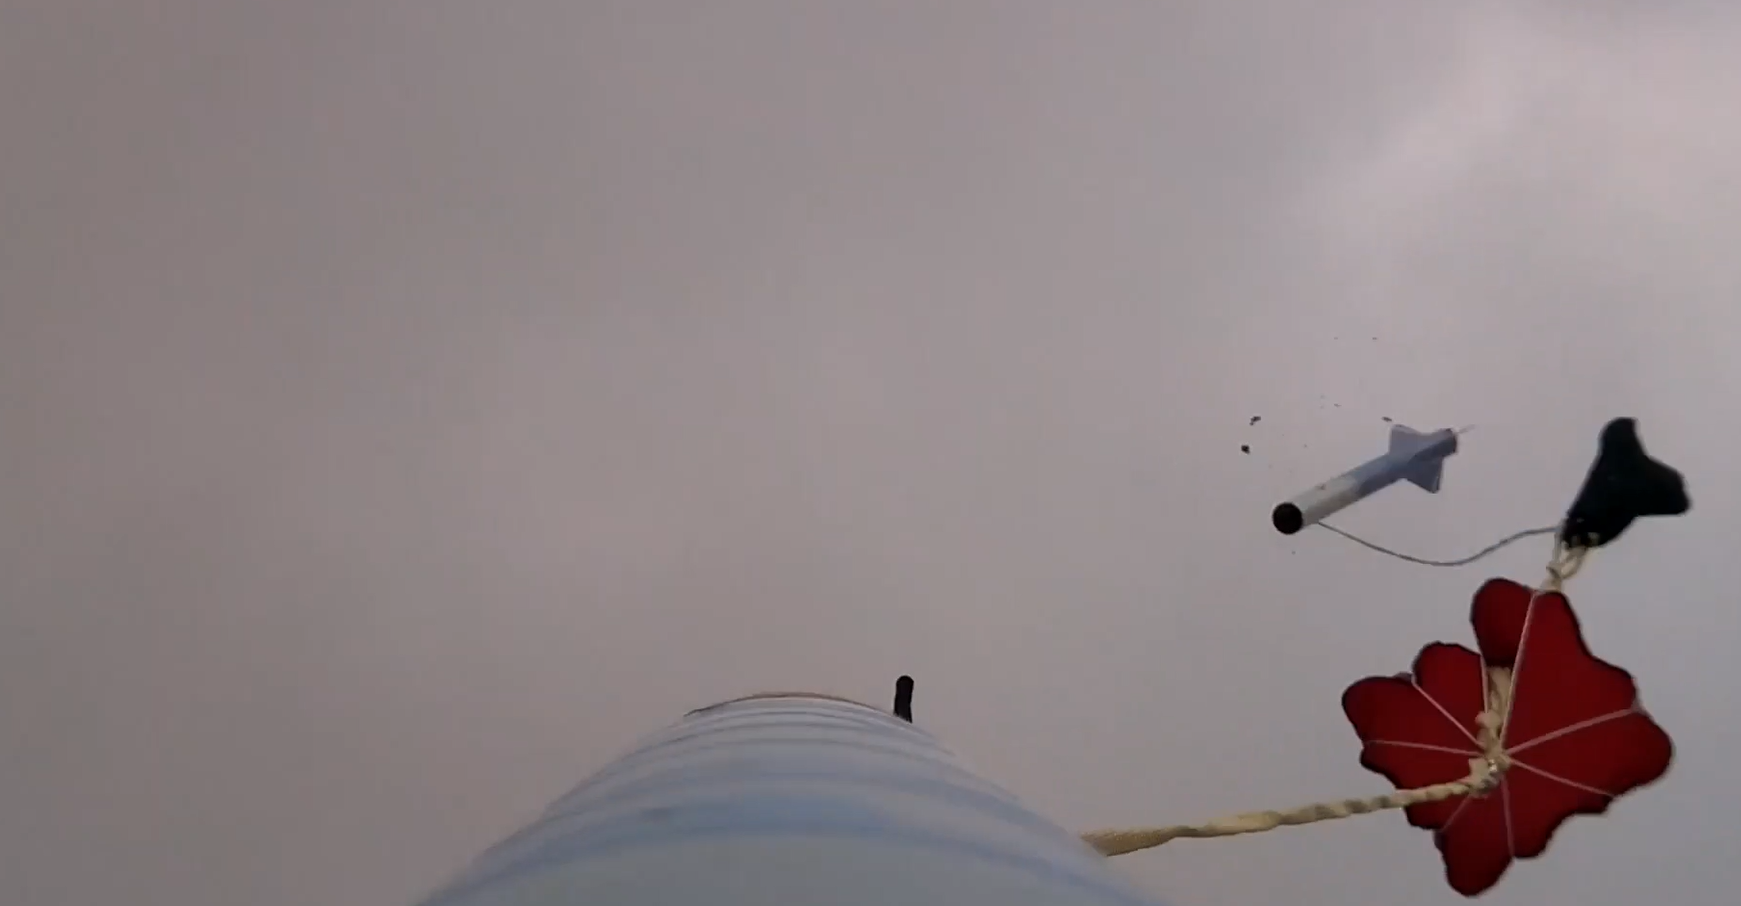
Descent Still Image from the Onboard Camera System (1)
Below is yet another descent picture, this time taken further into drogue descent. Something interesting to note here is that the booster appears farther away, and is still above the lower airframe. This is not something that I had expected to happen; normally the drogue parachute is the highest point in the falling system. However, this configuration implies that the booster section actually had more drag than my drogue parachute. This checks out because now that the propellant has burned off, the booster is fairly light and has a large surface area, especially when compared to the upper airframe which is heavy with avionics, a camera system, and a 48 inch main parachute.
This however was an interesting and unexpected result, and quite honestly I'm not sure what to do to fix it or if I need to fix it. It did not cause any problems, but did render the drogue parachute somewhat unused, or more of a descent mechanism for the upper airframe. This may be why people use separate recovery systems for the two sections. In the future, this is something I want to investigate and see if I can predict it.
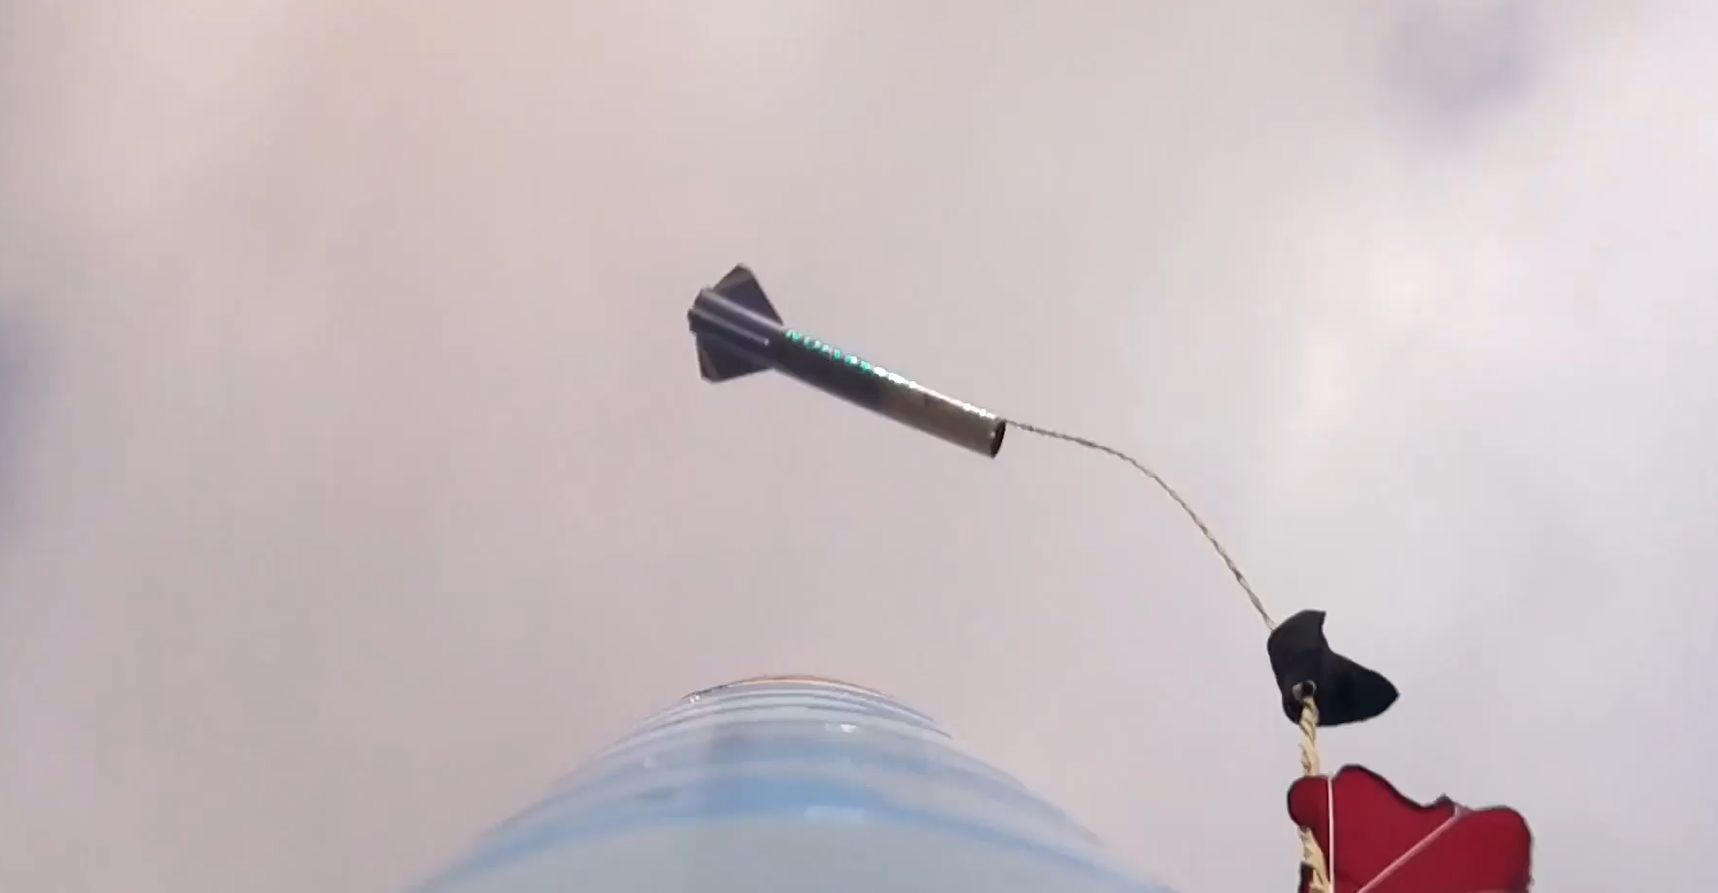
Descent Still Image from the Onboard Camera System (2)
The rest of the story becomes pretty murky as viewed from the ground, especially since it happened very quickly in real-time. What I observed was that the computer deployed the main parachute, at which point the main parachute took a while to inflate. The onboard camera footage shows that the main parachute became entangled in the kevlar shockcords until it was able to break free and fully inflate. This now brings us to the first bit of flight data we can analyze. This is the altitude data, which is plotted below. The blue line denotes the raw altitude readings, while the orange line denotes the altitude readings that the flight computer used to make decisions, which were adjusted using a moving mean of 5 elements.

Recorded Altitude Data - Raw and Filtered Readings
The altitude readings tell a more quantitative story. We know that the flight computer would've triggered the ejection charge once it detected an altitude of less than 250 meters. However, we see that the descent rate is altered at an altitude just above 100 meters. The time from 250 meters to 100 meters is a little less than 10 seconds, so we see that it took this much time for the main parachute to untangle itself and full inflate. This takes us from a descent rate of about 15 meters per second to one of about 6 meters per second. So, while very suspenseful to watch from the ground, it ended up working out alright.
Next up for examination is the recorded angular velocity. As noted in the video discussion, a high rate of roll was observed on ascent. This roll rate was so high, that it actually maxed out the range on the sensor (specifically for the z-axis rate of roll). This is why the yellow line in the plot below bottoms out several times across the graph as it reaches this limit. This was something very important I had not considered, and thus the range for the sensor will be adjusted before the next flight. This is something that is also critical to consider with respect to a system that might provide active roll control for a rocket. The full plot of recorded angular velocity data is given below. It is unfiltered.
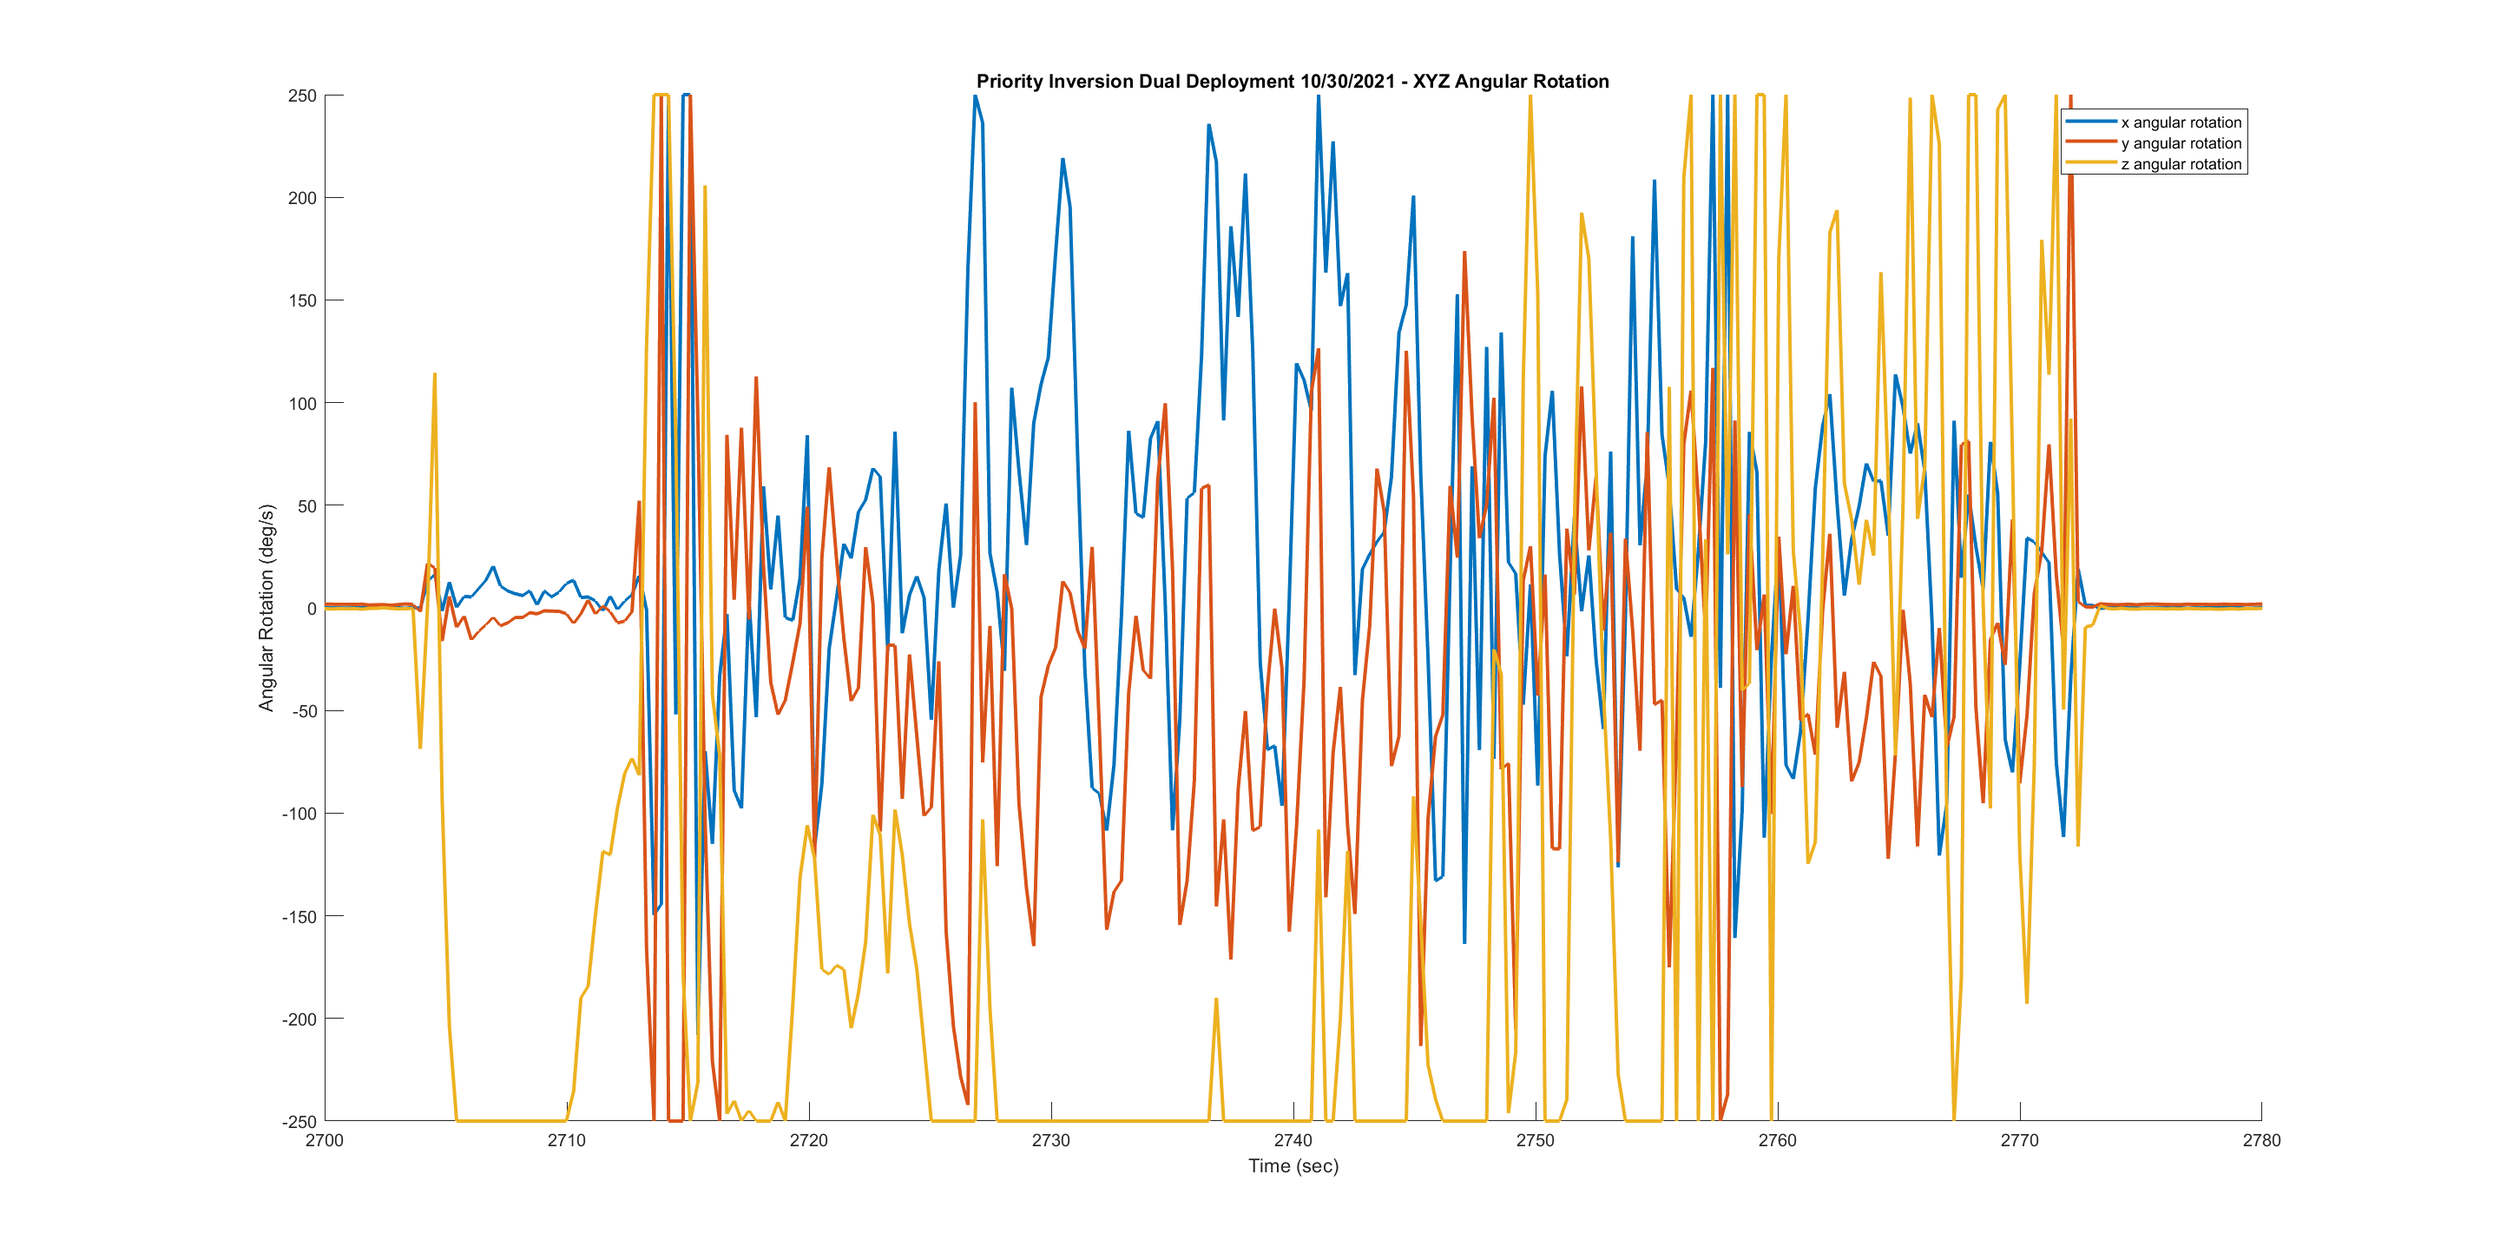
Recorded Angular Velocity Data
Next up is the acceleration data. I'll touch upon this in my closing statement, but I have reason to believe that this data is extremely incorrect due to a minimal sensor reading range. Regardless, the raw logged data from the flight computer is shown below. According to the flight computer, a maximum total acceleration of 3.4 g's was experienced.
Despite being far from the actual forces experienced by the rocket, a plus of this test is that it still could've been used to detect a launch ascent state. The caveat is that I will need to conduct more testing regarding expected values, and maybe run a system of mine in parallel with a COTS board to see if the readings match up.

Recorded Acceleration Data
While the flight computer did not log velocity, I thought that it would be interesting to examine because it is easy to calculate given that I had the altitude data with respect to time. Since the rocket was moving in not only the z-axis, this velocity represents the magnitude of the total velocity vector of the rocket. The plot below shows the velocity as calculated from the filtered altitude data (blue) and the velocity as calculated from the raw altitude data (orange). There are two interesting things to note. The first is that the lag caused by the moving mean filter is amplified in the velocity calculation. The second observation is that the error in the raw altitude readings was amplified in the calculated velocity, as you can see by the very spikey orange plot. These observations both make sense because the errors either between data sets (in the case of the lag) or the error within a data set (in the case of the spikes) would be amplified by subjecting them to further calculation. This was pretty neat to see in real life.

Calculated Velocity Data
Finally, we have the cumulative plot below which also points out key flight events. It shows both the filtered altitude in addition to the total acceleration. it also shows the filtered apogee, which was recorded to be 746.41 meters. It also shows the time at which the main parachute was deployed, in addition to the time at which the main parachute finally inflated.

Total Recorded Launch Data
Overall, I would say that this was a successful flight in which I gathered a lot of data, learned a lot, and was able to launch another day. I'm just thankful that the sensors with improper ranges were not directly tied to the choices made by the flight computer.
closing thoughts and next steps
Something that I thought would be fun to do is to compare the simulated values with the recorded values:

Overall, we can see that the simulation was pretty spot-on for the most part. The large difference in apogee isn't too unexpected, since I used perfect weather conditions in the OpenRocket simulation, and there may have been minor deviations in mass and the specific motor I used (I matched total impulse for the simulation, but it wasn't the exact motor). Interestingly enough, the rocket went a bit faster than expected, and reached apogee quicker. This, coupled with the early-ish ejection made for an interesting flight. The only odd measurement from the flight computer seems to be the acceleration value. In writing this document, I thought that the sensor on the flight computer had a maximum range of +-8 g's, such that it should've been able to record values within the expected simulated range. But, upon looking at the code, it appears I overlooked this setting and that the sensor instead had a range of +-2 g's, which was a major mistake on my part. Just for fun, I went ahead and calculated the acceleration based on the calculated velocity and came up with a maximum acceleration of 105 m/s^2, or 10.7 g's, which is also significantly higher than the expected value, but is more believable than the super small readings. But, it is also a lot of acceleration, and due to propagation of error from the original collected position data I'm not sure how accurate it is. The important thing here is that next time I'll be sure to set my sensors to utilize their full range of readings.
Finally, we have my goals for the future:
Construct a system that is easier to integrate.
Use a mag-switch or key-switch so that the vehicle can be armed/turned on once it is already integrated.
Check all sensor ranges and make sure they can record valid readings throughout the flight.
Add live telemetry.
Add GPS data.
Add in a state system where the computer jumps from state to state in-flight. Then, it will enter a recovery state in which it plays a loud noise, and flashes lights.
Create a nice program that automatically parses all collected data and displays it.
Create a recovery system that is not BP-based.
Add in apogee detection for the flight computer.
Learn PCB creation and SMD soldering and create a custom board for the flight computer and assemble it.
Create a dynamic system that only stops logging data once it detects that it has landed.
Perform robust file operations such that if the system crashes data is not lost (open and close the file every time you write to it).
Figure out what settings are needed for the IMU to work for the expected force envelope a rocket experiences (angular velocity, acceleration, etc).
Test all of the above by creating a ground station and system that goes on an RC cargo plane.
In short: I am extremely happy with how this project worked out, and I can't wait to improve it.